This step-by-step tutorial explains how to create a simple Ionic 4 mobile application with a line chart in Appery.io.
Introduction
In this detailed tutorial, you will learn how to build a mobile app with a chart inside of it.
Before You Start
- Tutorial level: beginner; your first mobile app.
- Prerequisites: an Appery.io account.
Creating New App
- On the Apps tab, click Create new app.
- Select Ionic 4 as the application type, enter an app name, for example, ChartApp, and click Create.
Building UI
The new application appears with a default first page. To build the UI for your app:
- Under the Project view, unfold Pages and open Screen1.
- From PALETTE on the left, drag & drop a Chart component to the screen. The screen should look like this:

Adding Chart to the Screen1 page
Defining Application Logic
- Switch to the CODE panel, add a variable: data with type Any, and specify its value as array of numbers (for example,
[65,78,45,214, 456]). These numbers will be used to draw your line chart:

Adding data variable
- Go back to the DESIGN panel and select the Chart Data component inside your app.
- Then, under the PROPERTIES menu on the right, specify its property Data as data.

Defining ChartData
Now, click the TEST button to check if your line chart looks good on the screen.
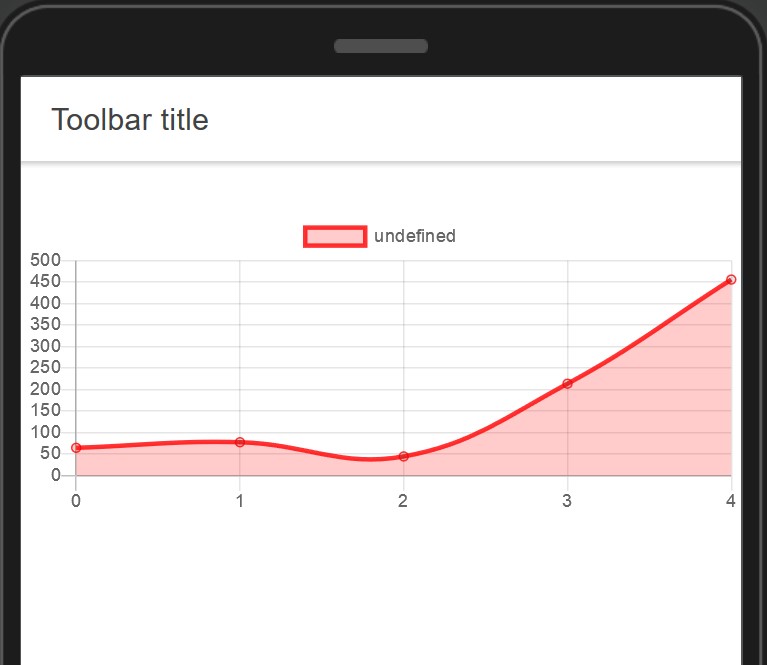
As we can see it looks OK, but we can make it more informative so let's add labels to it.
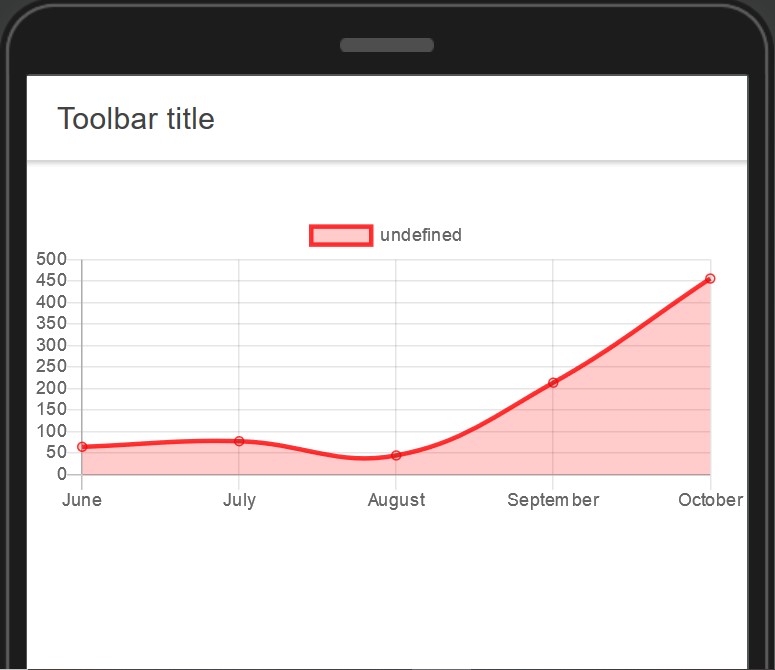
- On the CODE panel, add one more variable: labels with type Any and specify the value as array of labels (for example,
["June", "July", "August", "September", "October"]).
Now, the Variables section should look like this:

Variables
- Go back to the DESIGN panel, select the chart container and under the PROPERTIES menu on the right, specify the property Label as labels:

Defining Chart
Click Save and test again:
- Now, you can go back to the editor and define the name of your line chart by selecting the Chart Data component and specifying the Legend Label property as My Chart.
But before we finish, let’s also add a title to our chart. - Select the chart container again and for Show Advanced Properties select Title, then expand the Title property below, specify the property Text as My First Chart Title, and set the property Display to True:

Defining Chart Title advanced property
- Click Save and then TEST:

Resulting app
You can also check this Appery.io Community video that shows how to draw a line chart in an Ionic 4 app: