Appery Debugging
How to debug your app using the Appery built-in tools.
Using Remote Debugger
The Remote debugging feature allows you to inspect and debug the app’s internal state from a web-based debugger.
To enable it, go to the App settings > General tab and check the Enable remote debugging checkbox.
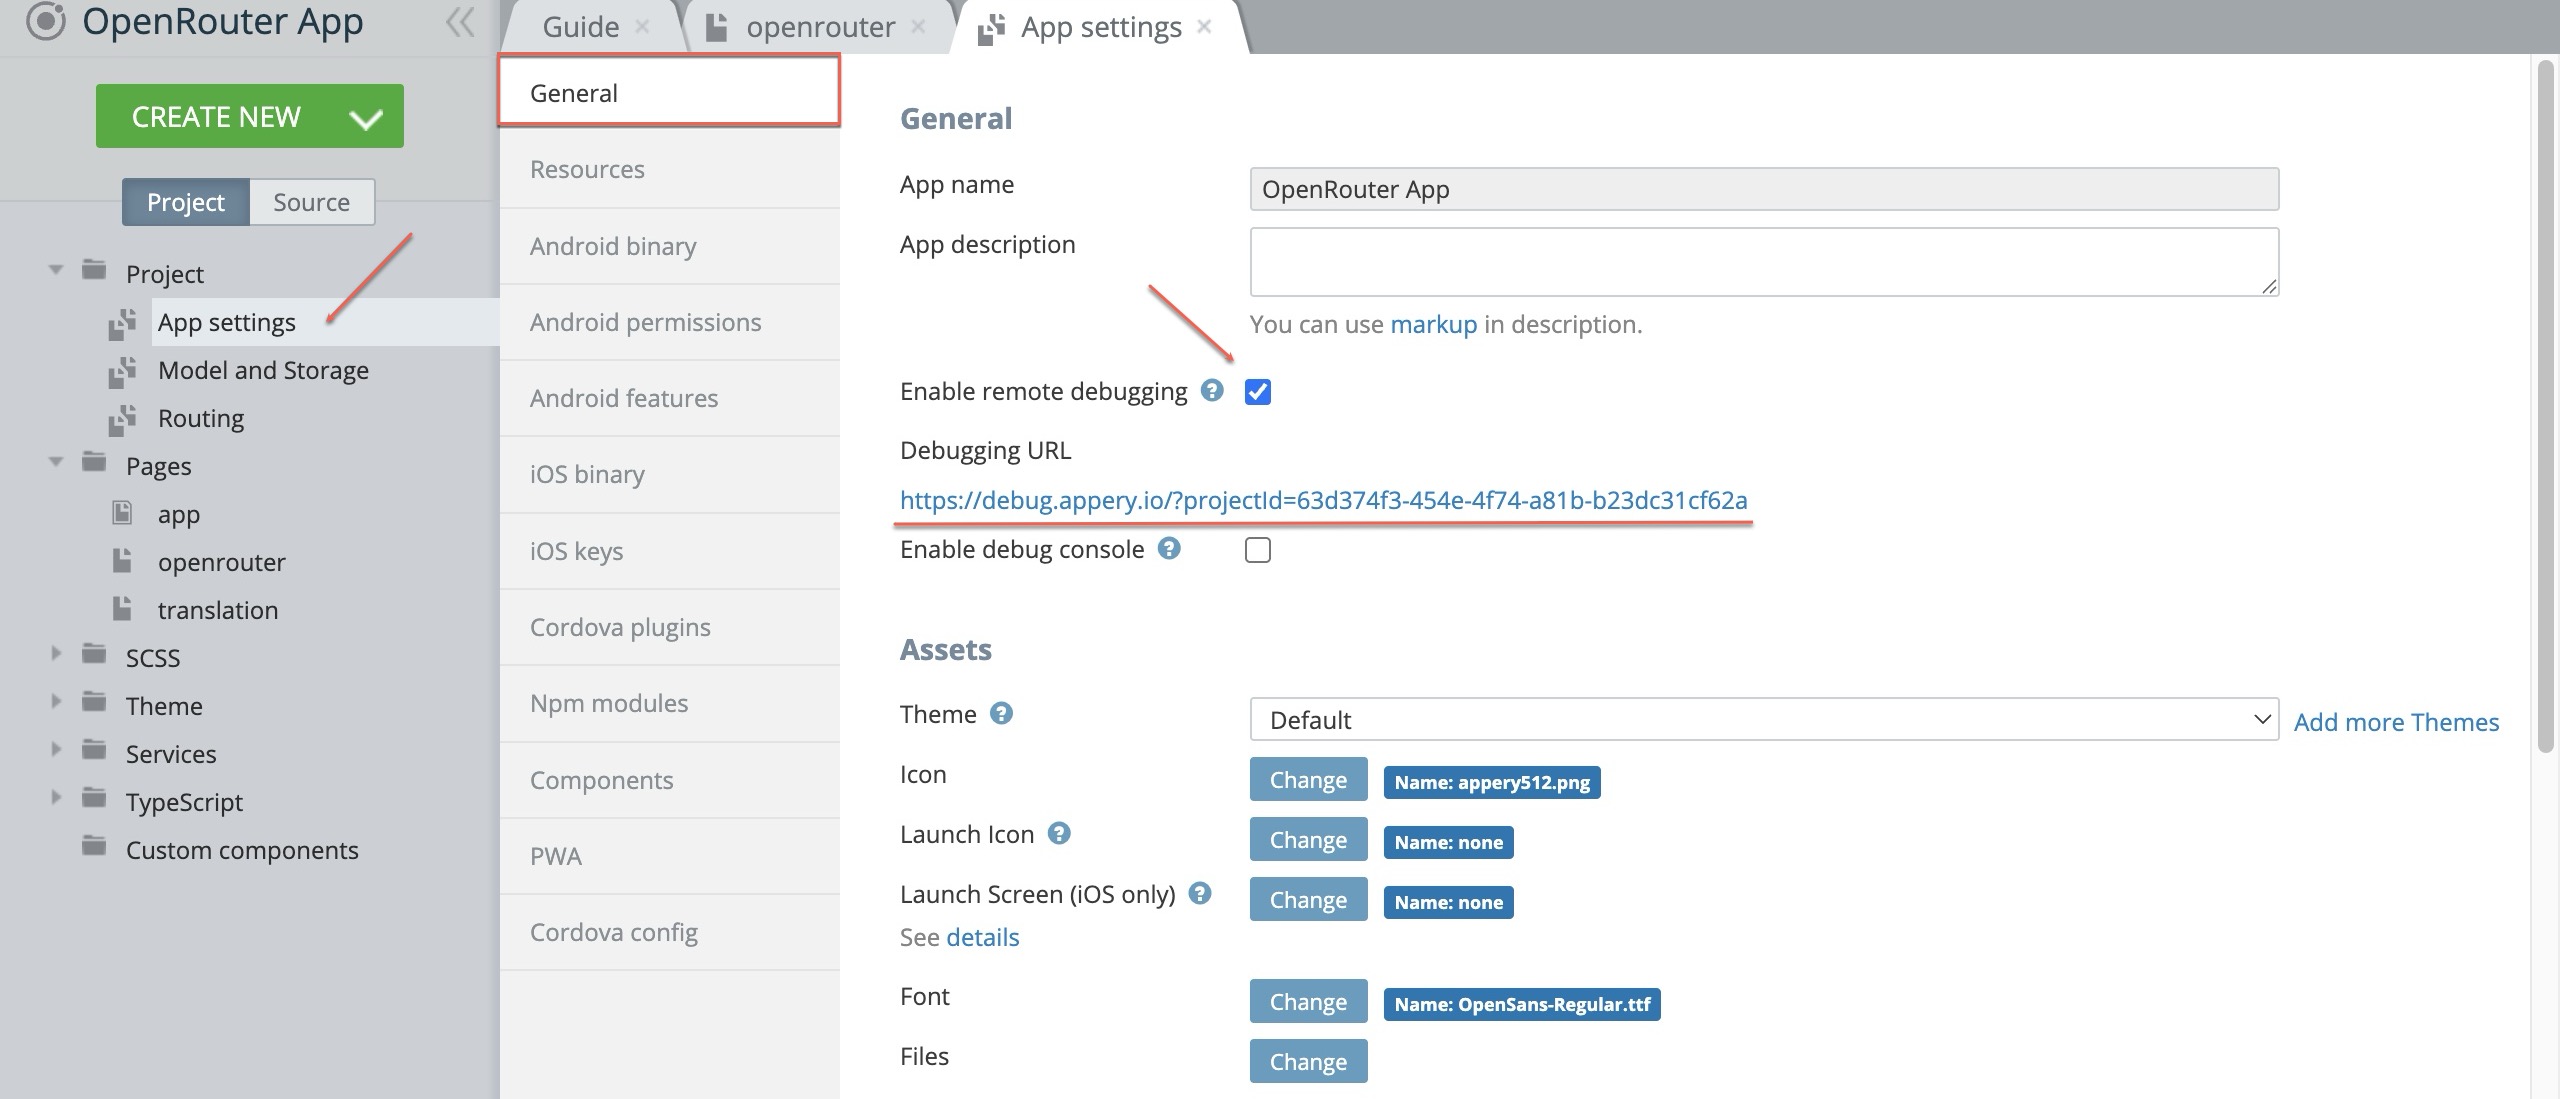
A debugging URL will appear. Click it to open a new tab where you can start debugging your project.
Before DebuggingOpen the app Preview in the browser.
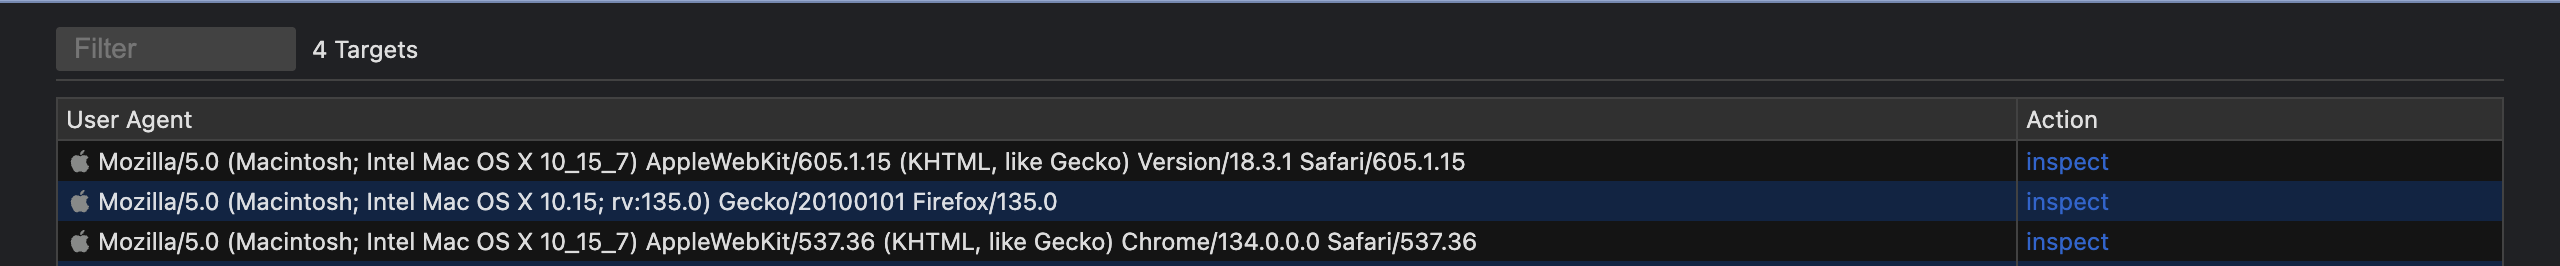
You’ll see all of the target devices and client browsers connected to the debugger. If you are running multiple application instances, multiple targets will be shown (with the active target highlighted).
Click Inspect to activate the default browser debugger to check the device that you are going to debug:
TIPYou can check this page for the list of supported browsers.
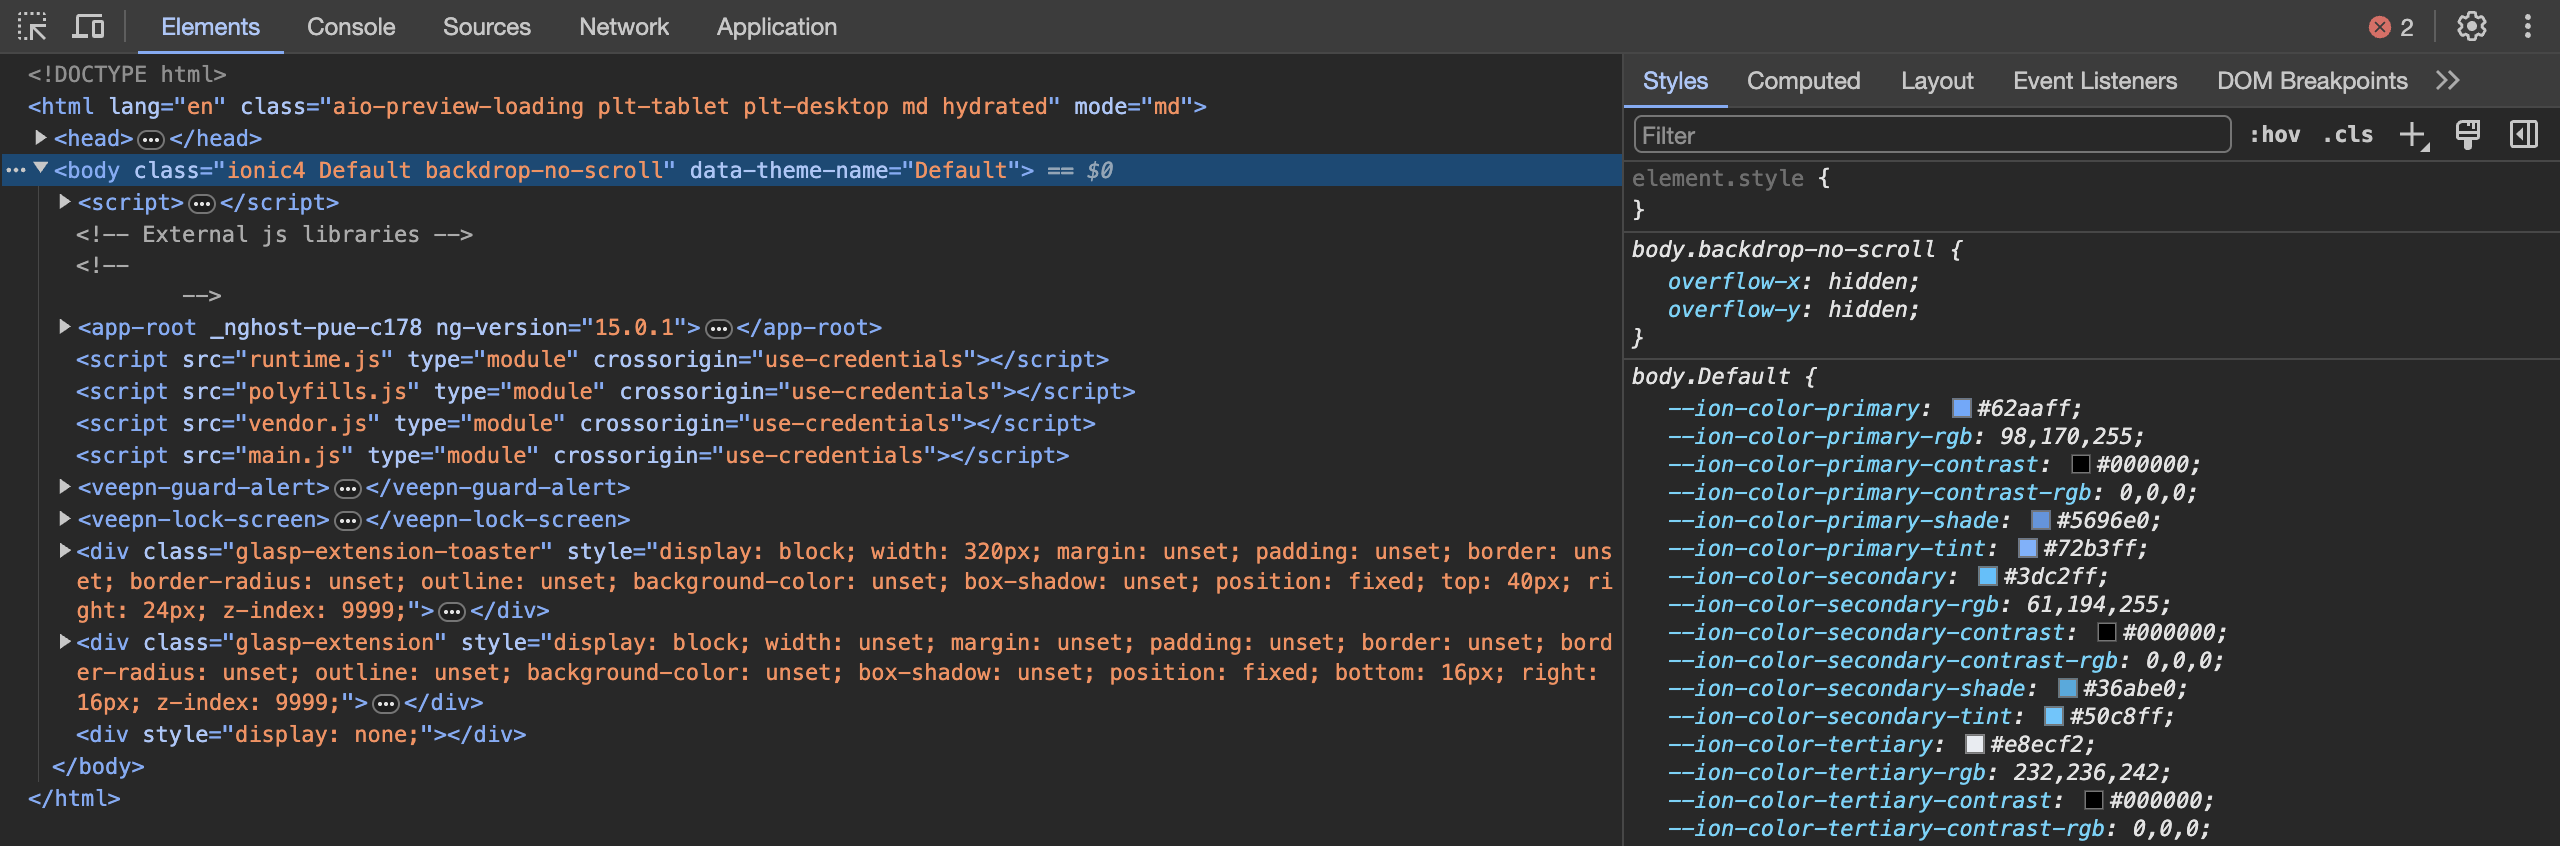
Then, switch between the tabs to access the particular debugging view.
For example, in the Elements view, you can inspect the DOM elements, (you can also edit attributes, styles and properties). The actual component layout is instantly highlighted in the running app:
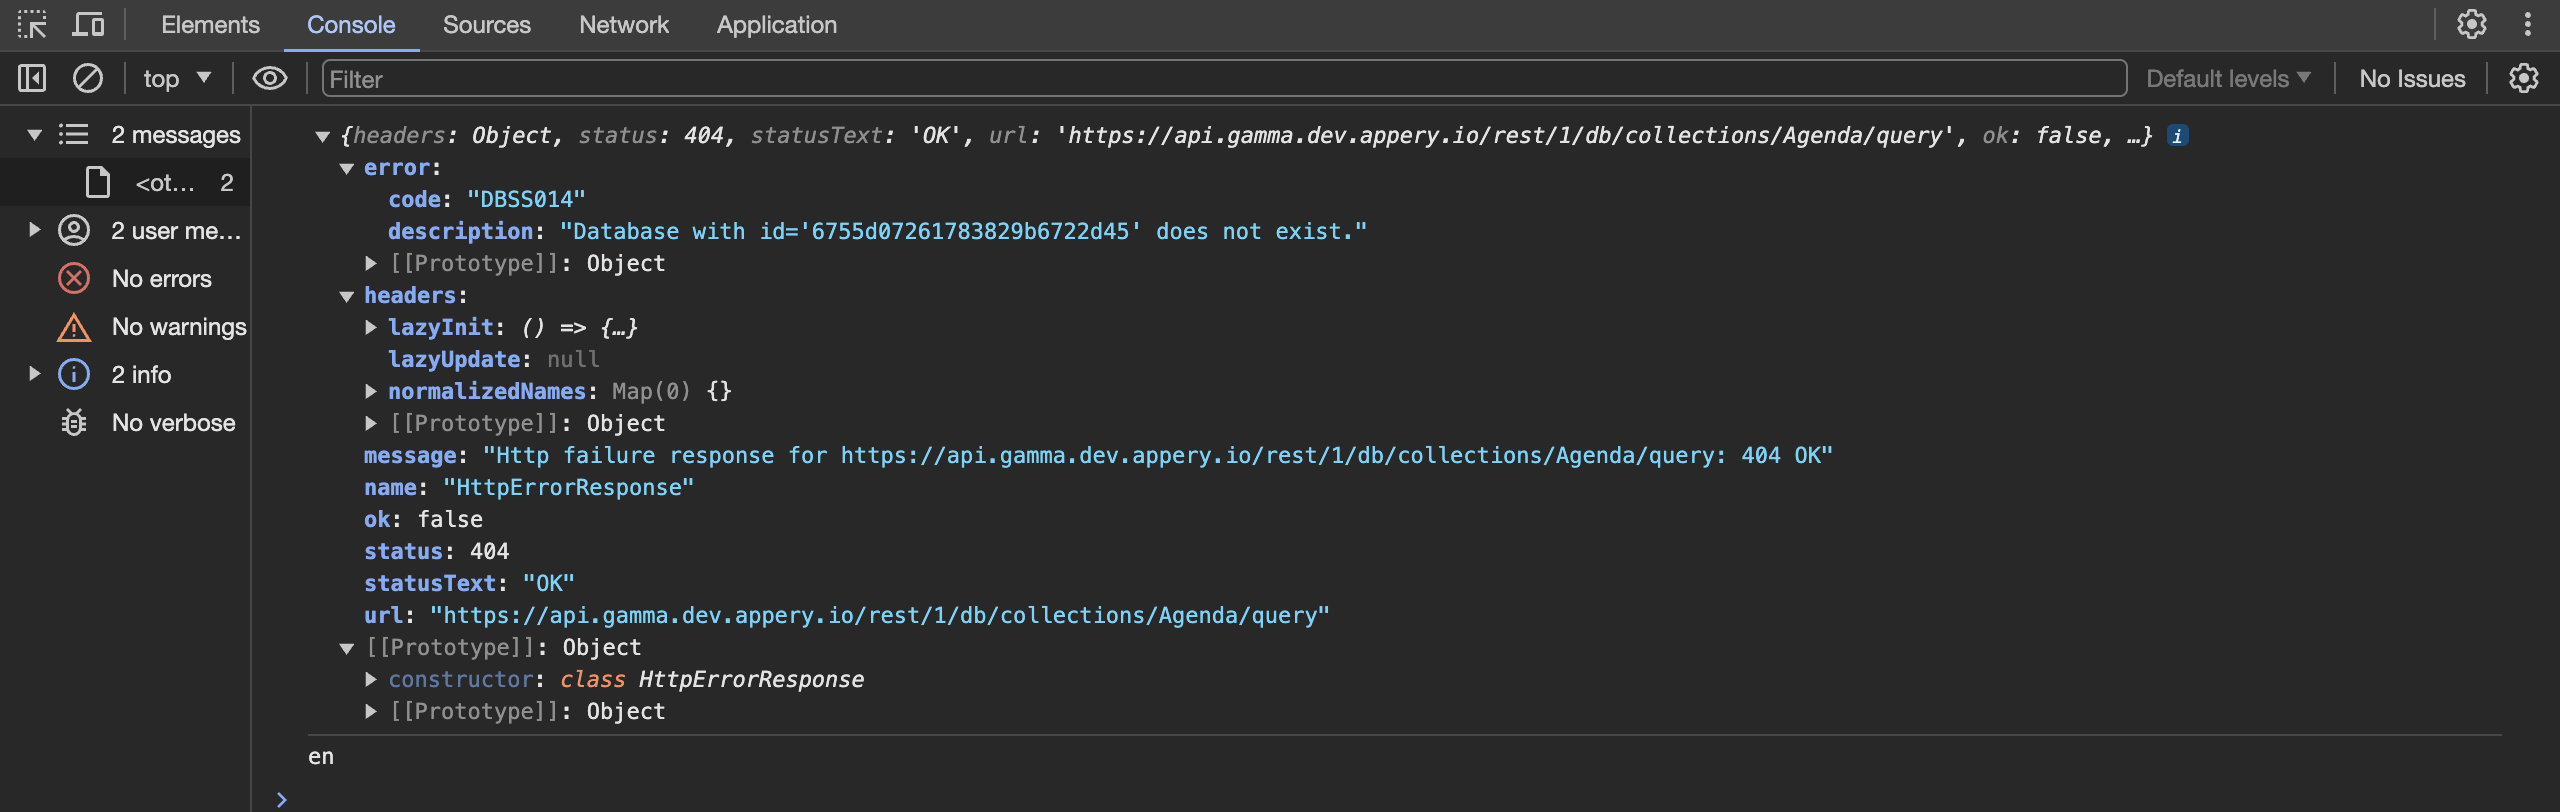
The Console view allows running JavaScript that will execute in your app:
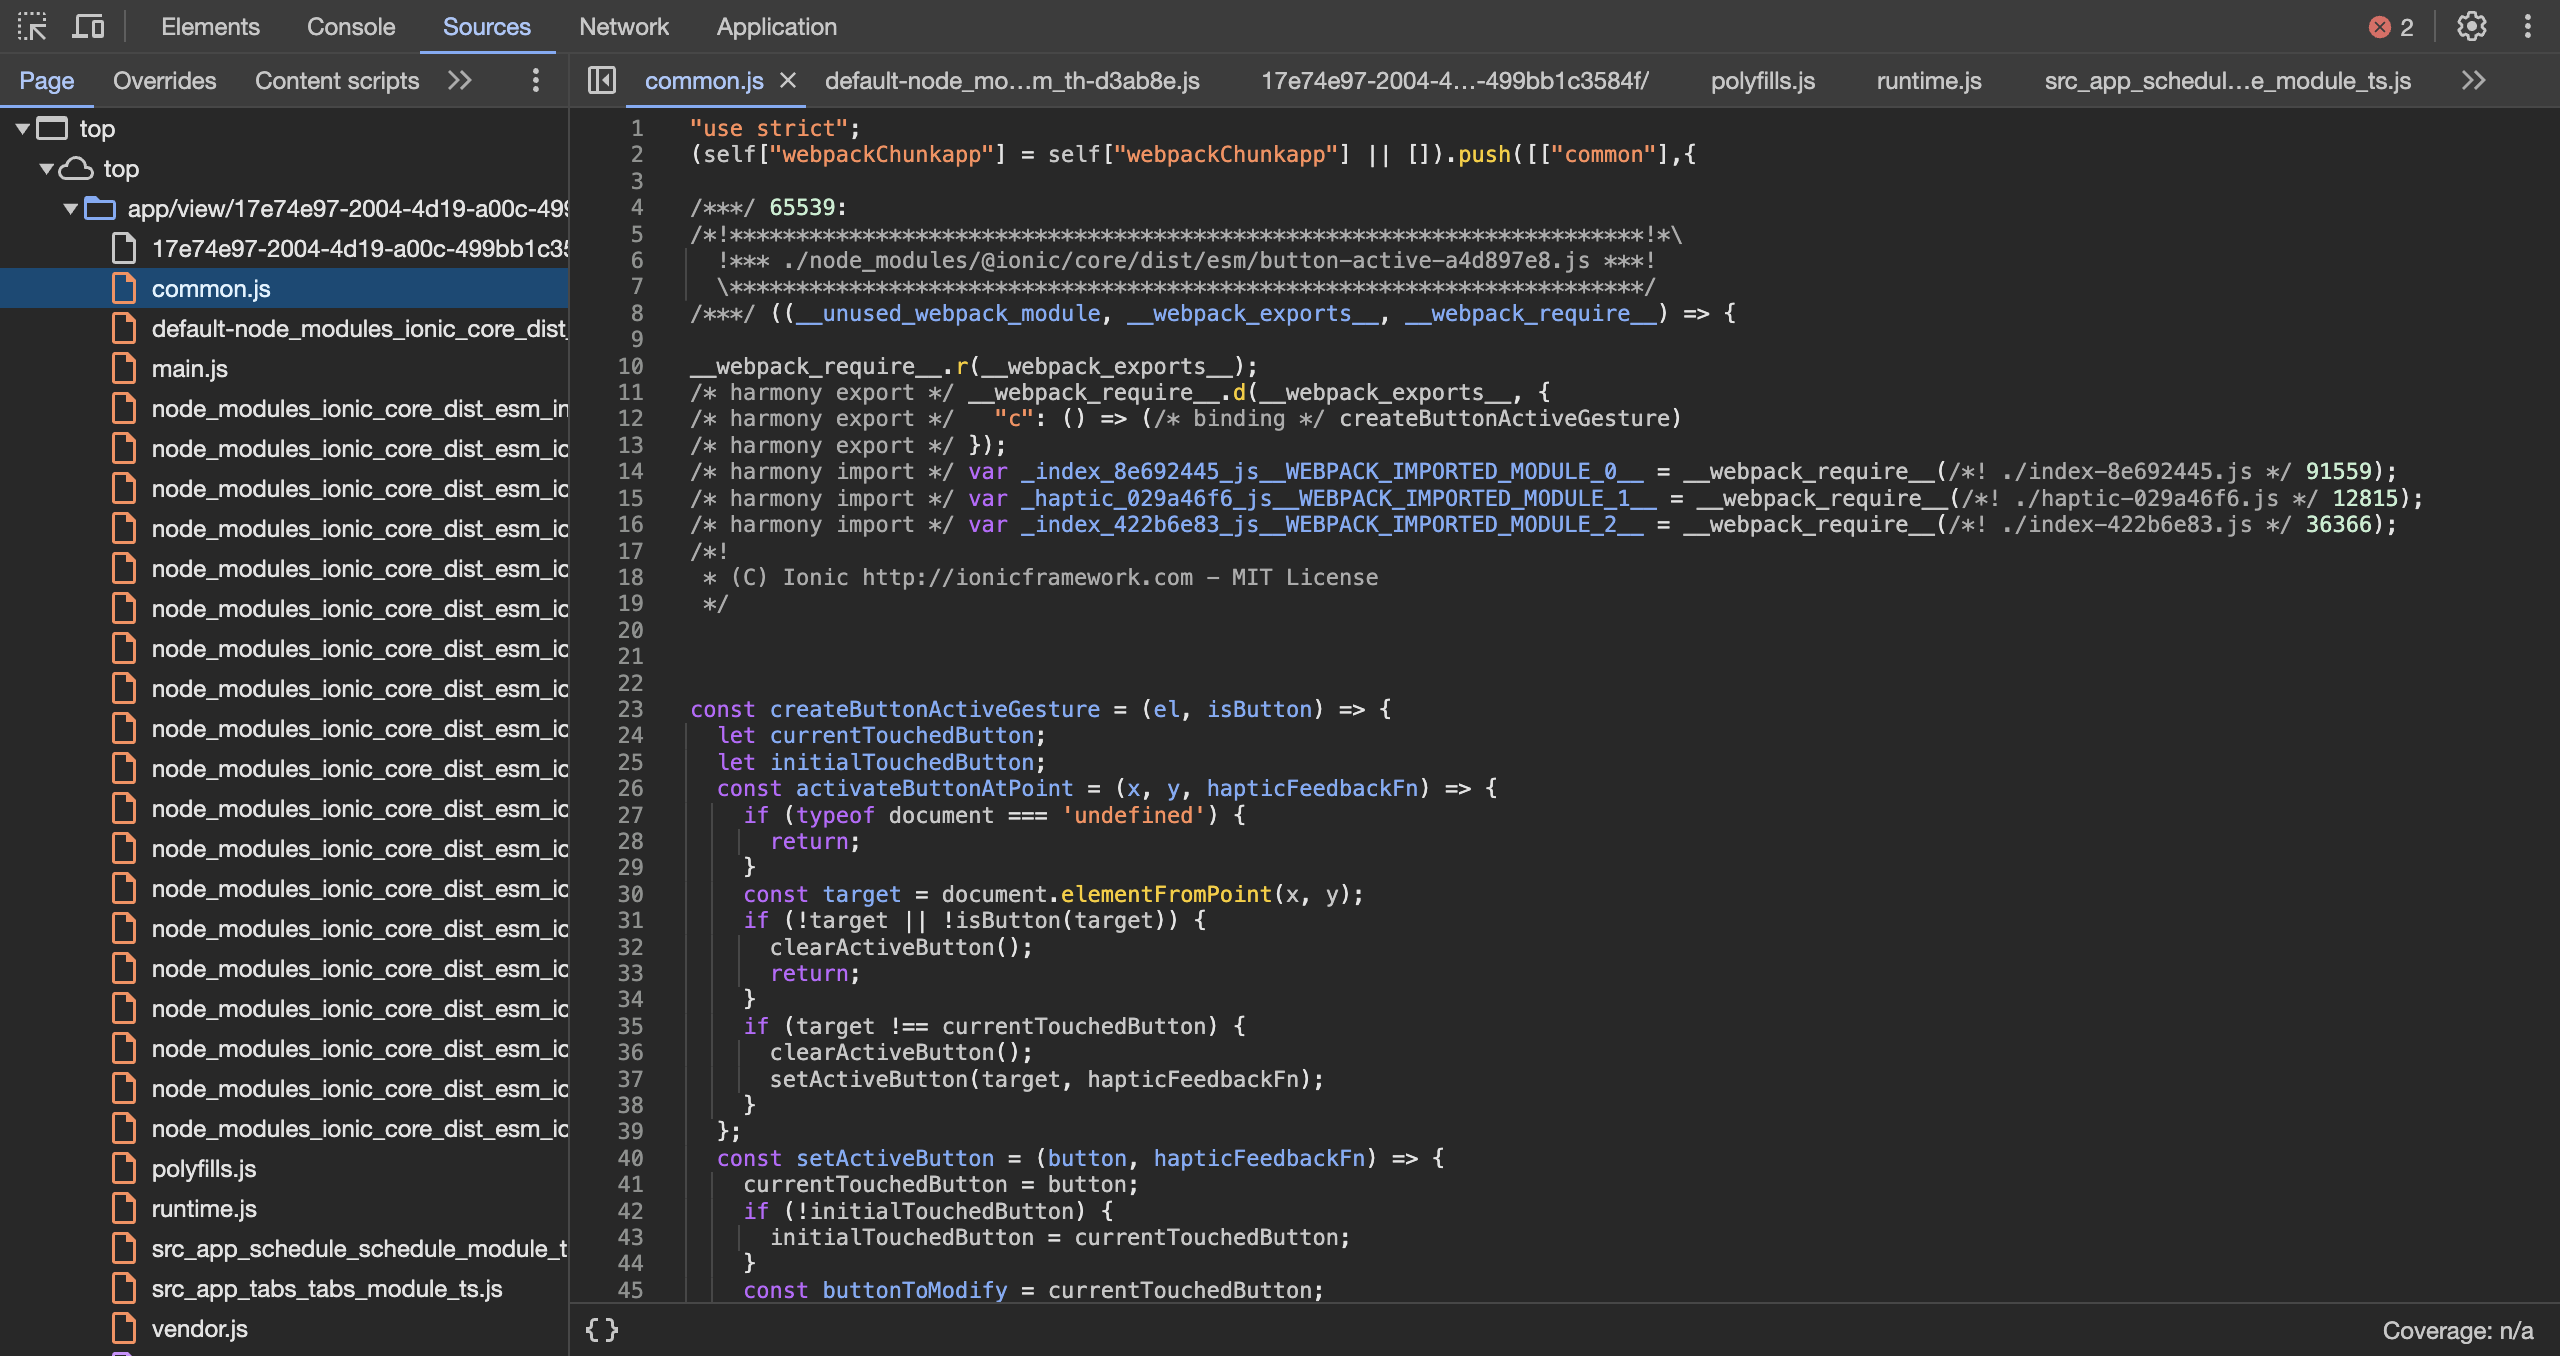
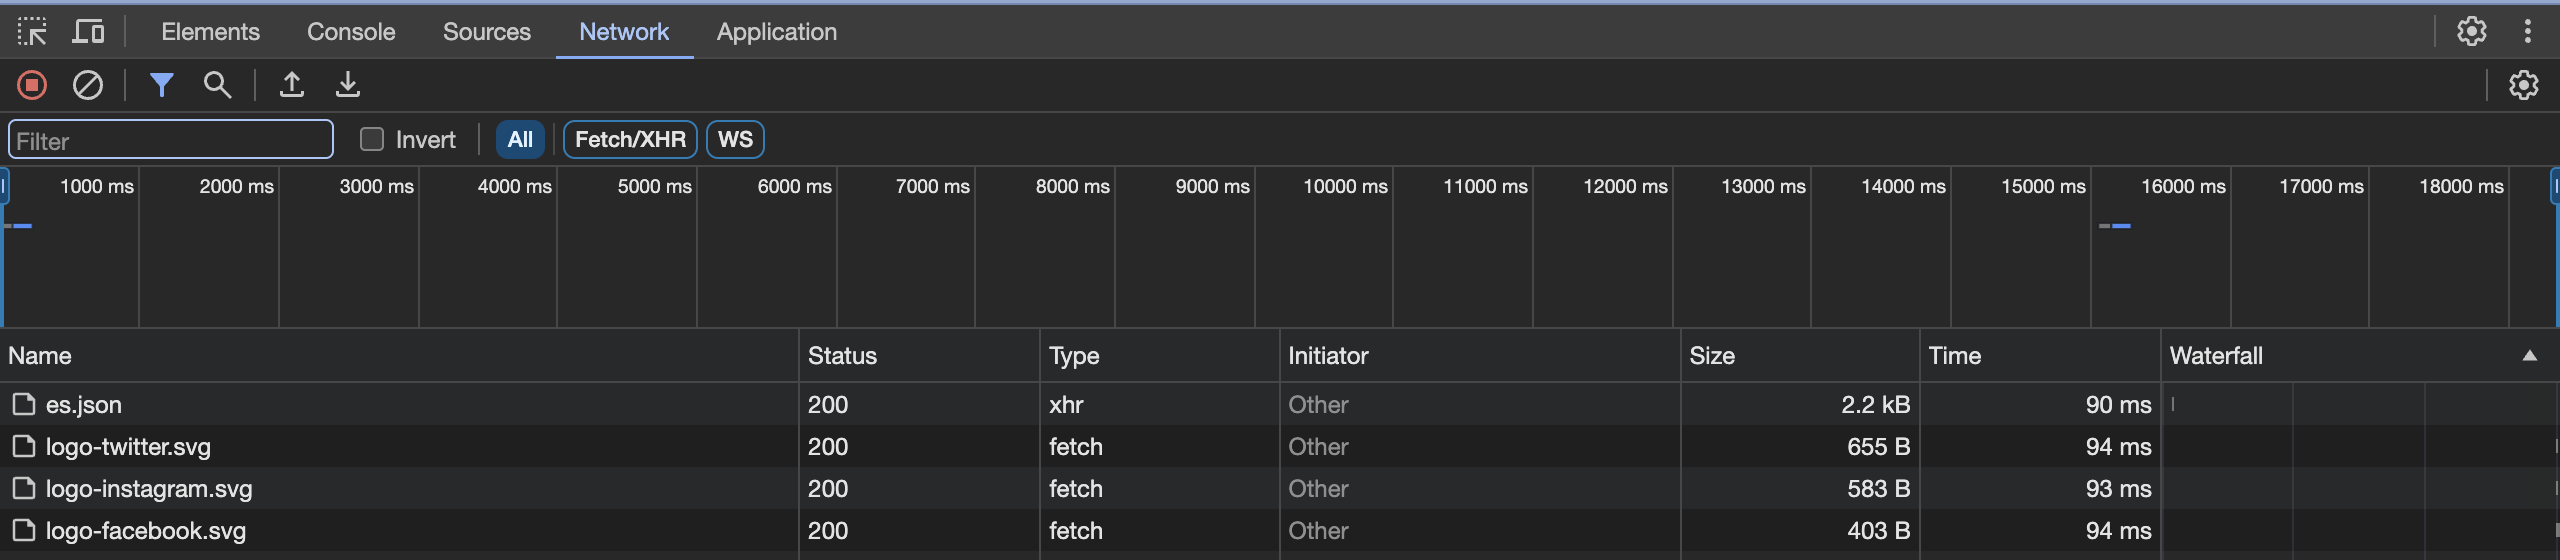
The Network inspector allows you to see all of the network requests (except JSONP requests):
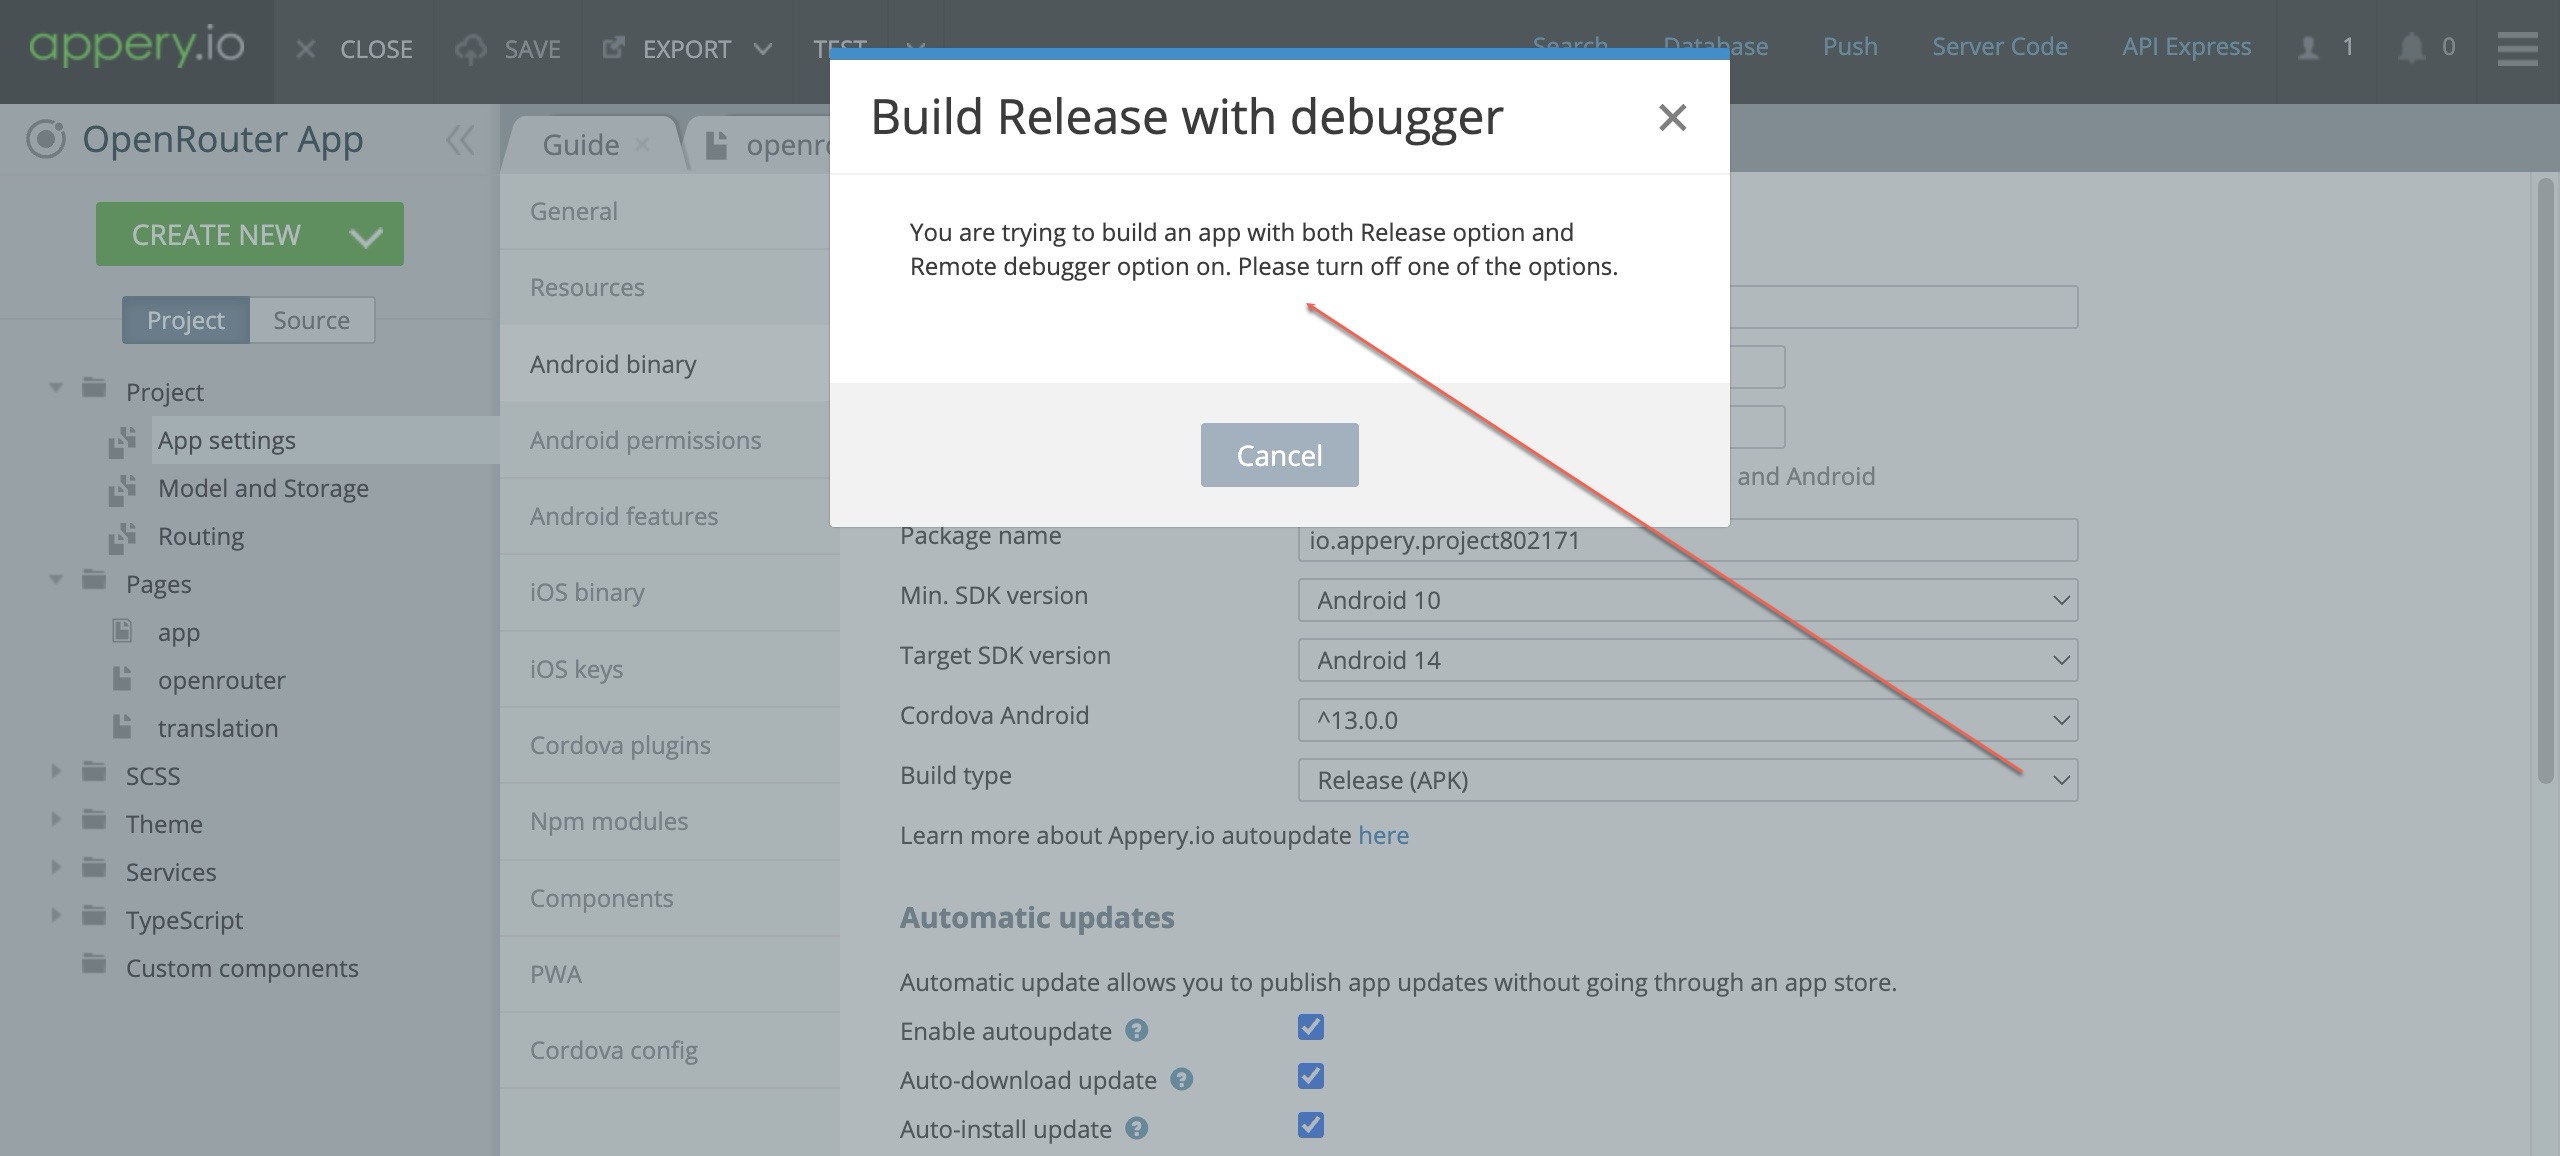
Important!Note that you cannot export your app and publish it to an app store with the Remote debugging option enabled!
Want to Know More?Check our YouTube video tutorial to learn how to fix errors and optimize apps quickly. Learn how to use Appery debugger, inspect variables, and improve JavaScript debugging. We cover mobile app debugging and remote troubleshooting with simple steps. Watch now to get pro tips and make your app run smoothly:
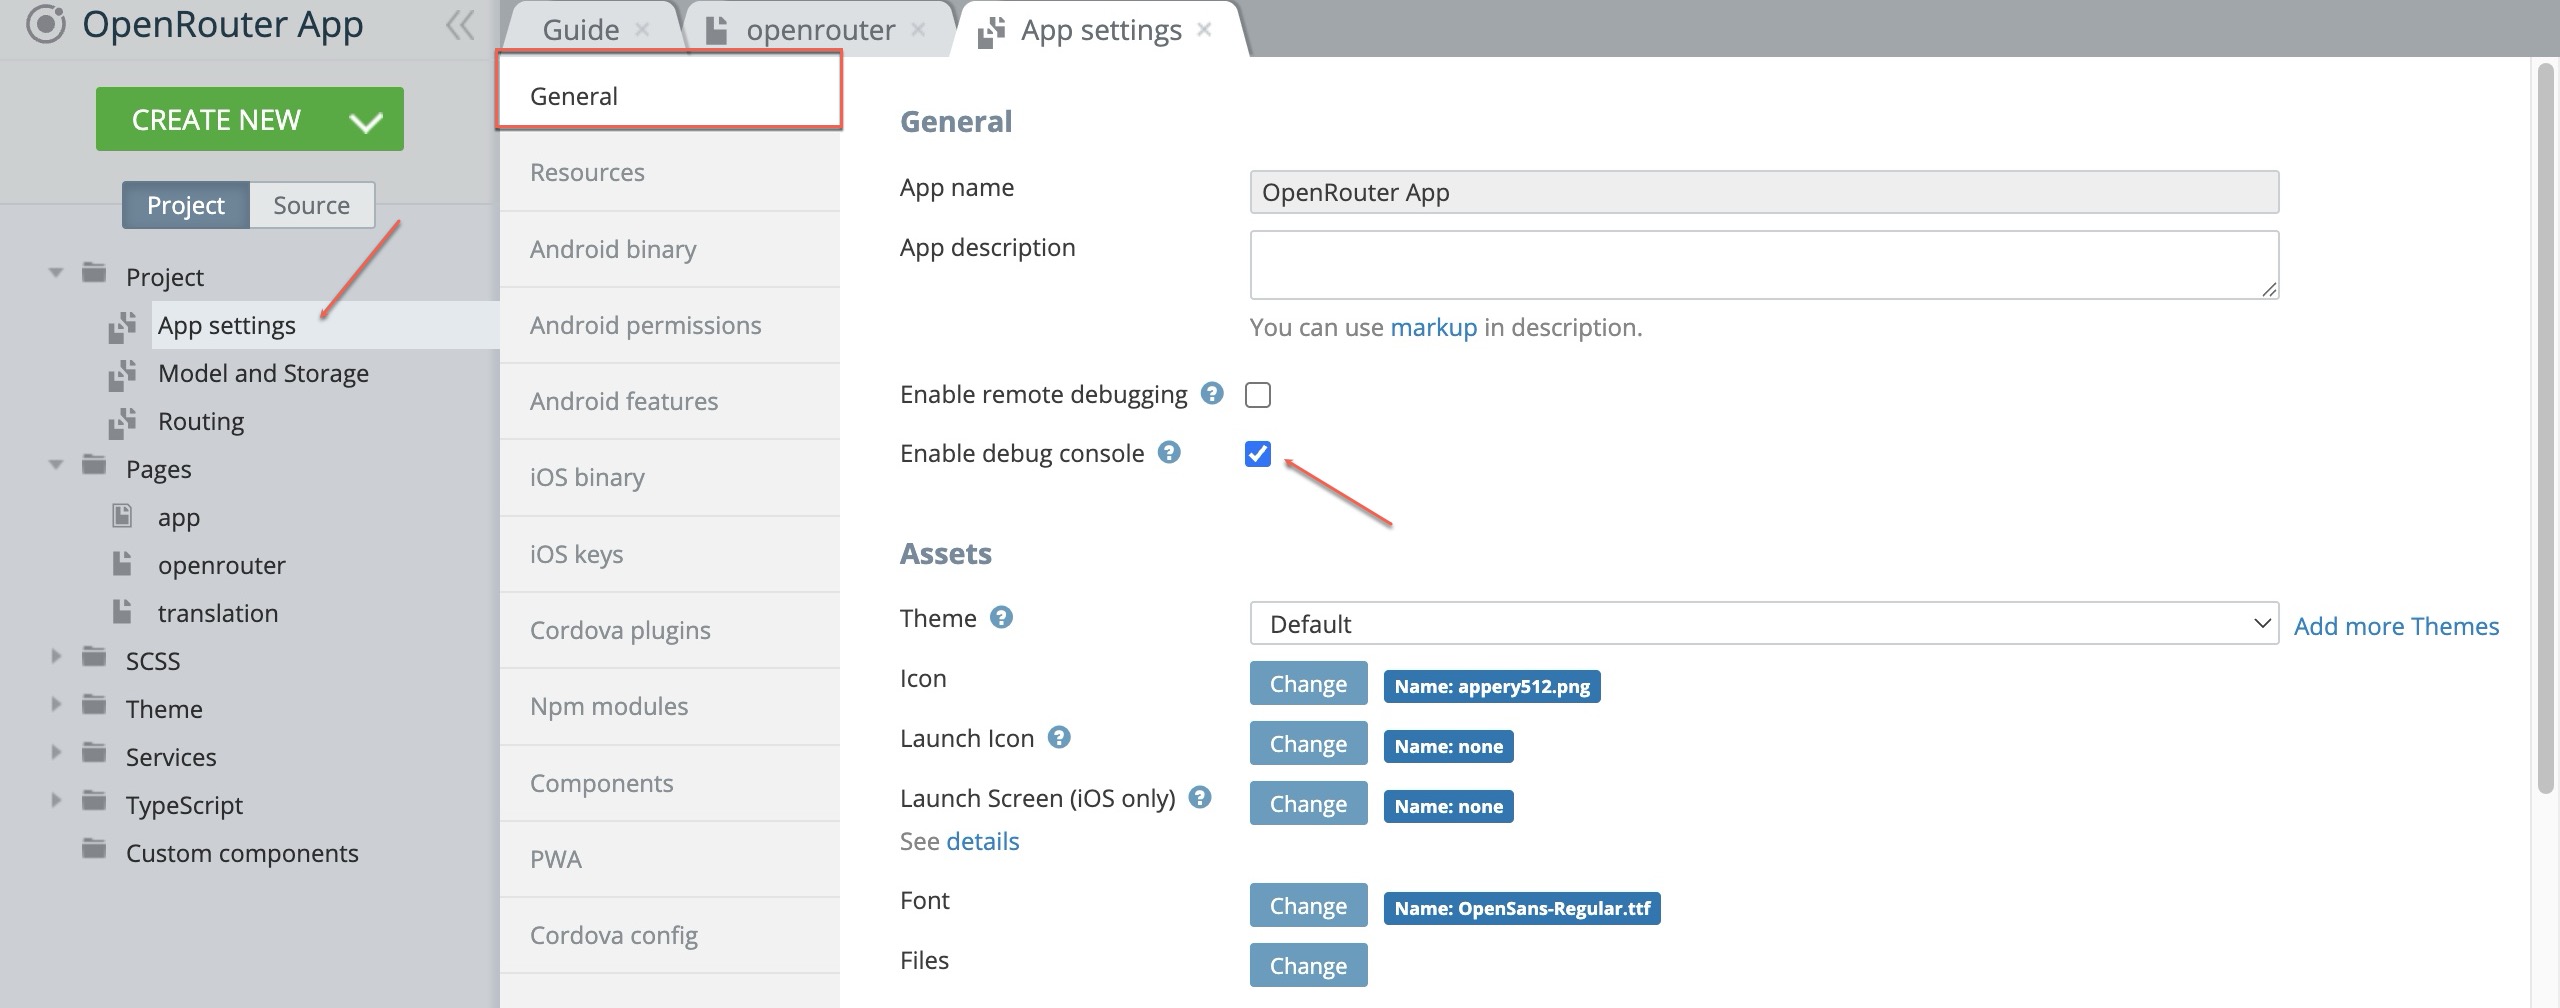
Enabling Debug Console
Another debugging option is using the Debug console feature. It is not linked to any server and can be used to run local debugging:
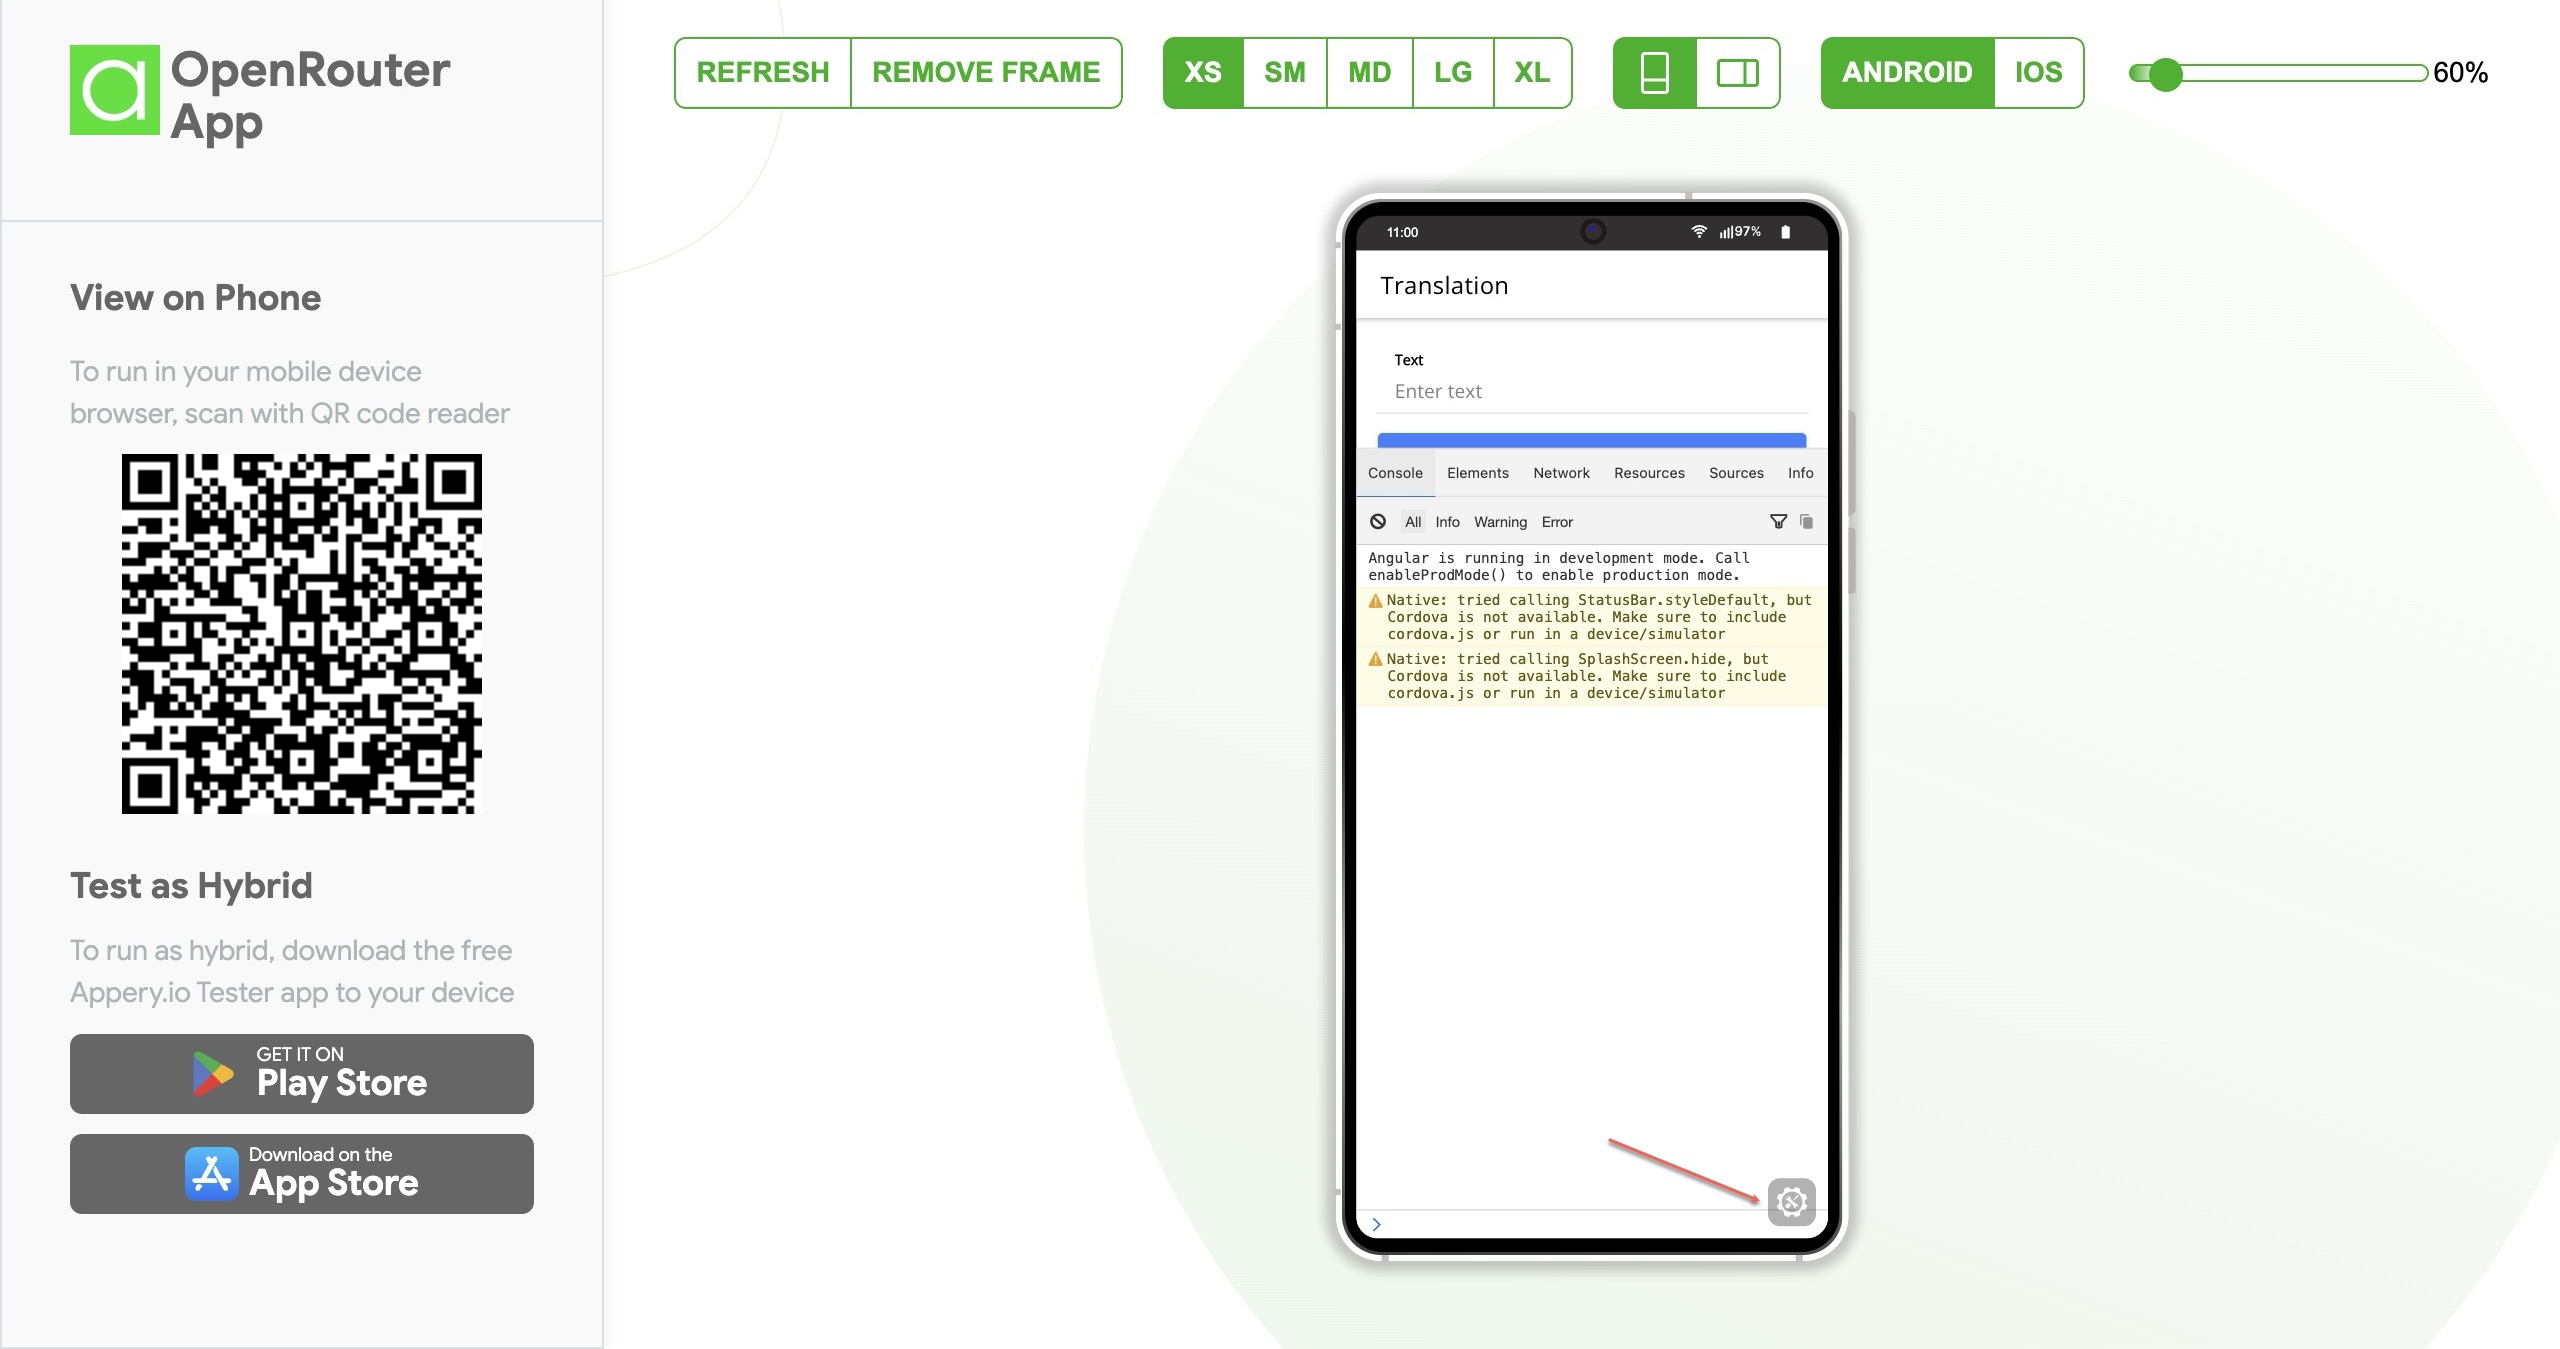
Once the debug console is enabled, the draggable widget will be shown when the app is run in the testing mode.
Before DebuggingOpen the app Preview in the browser or click Test on the device and scan the QR code, otherwise, you can install the app binary file on a device.
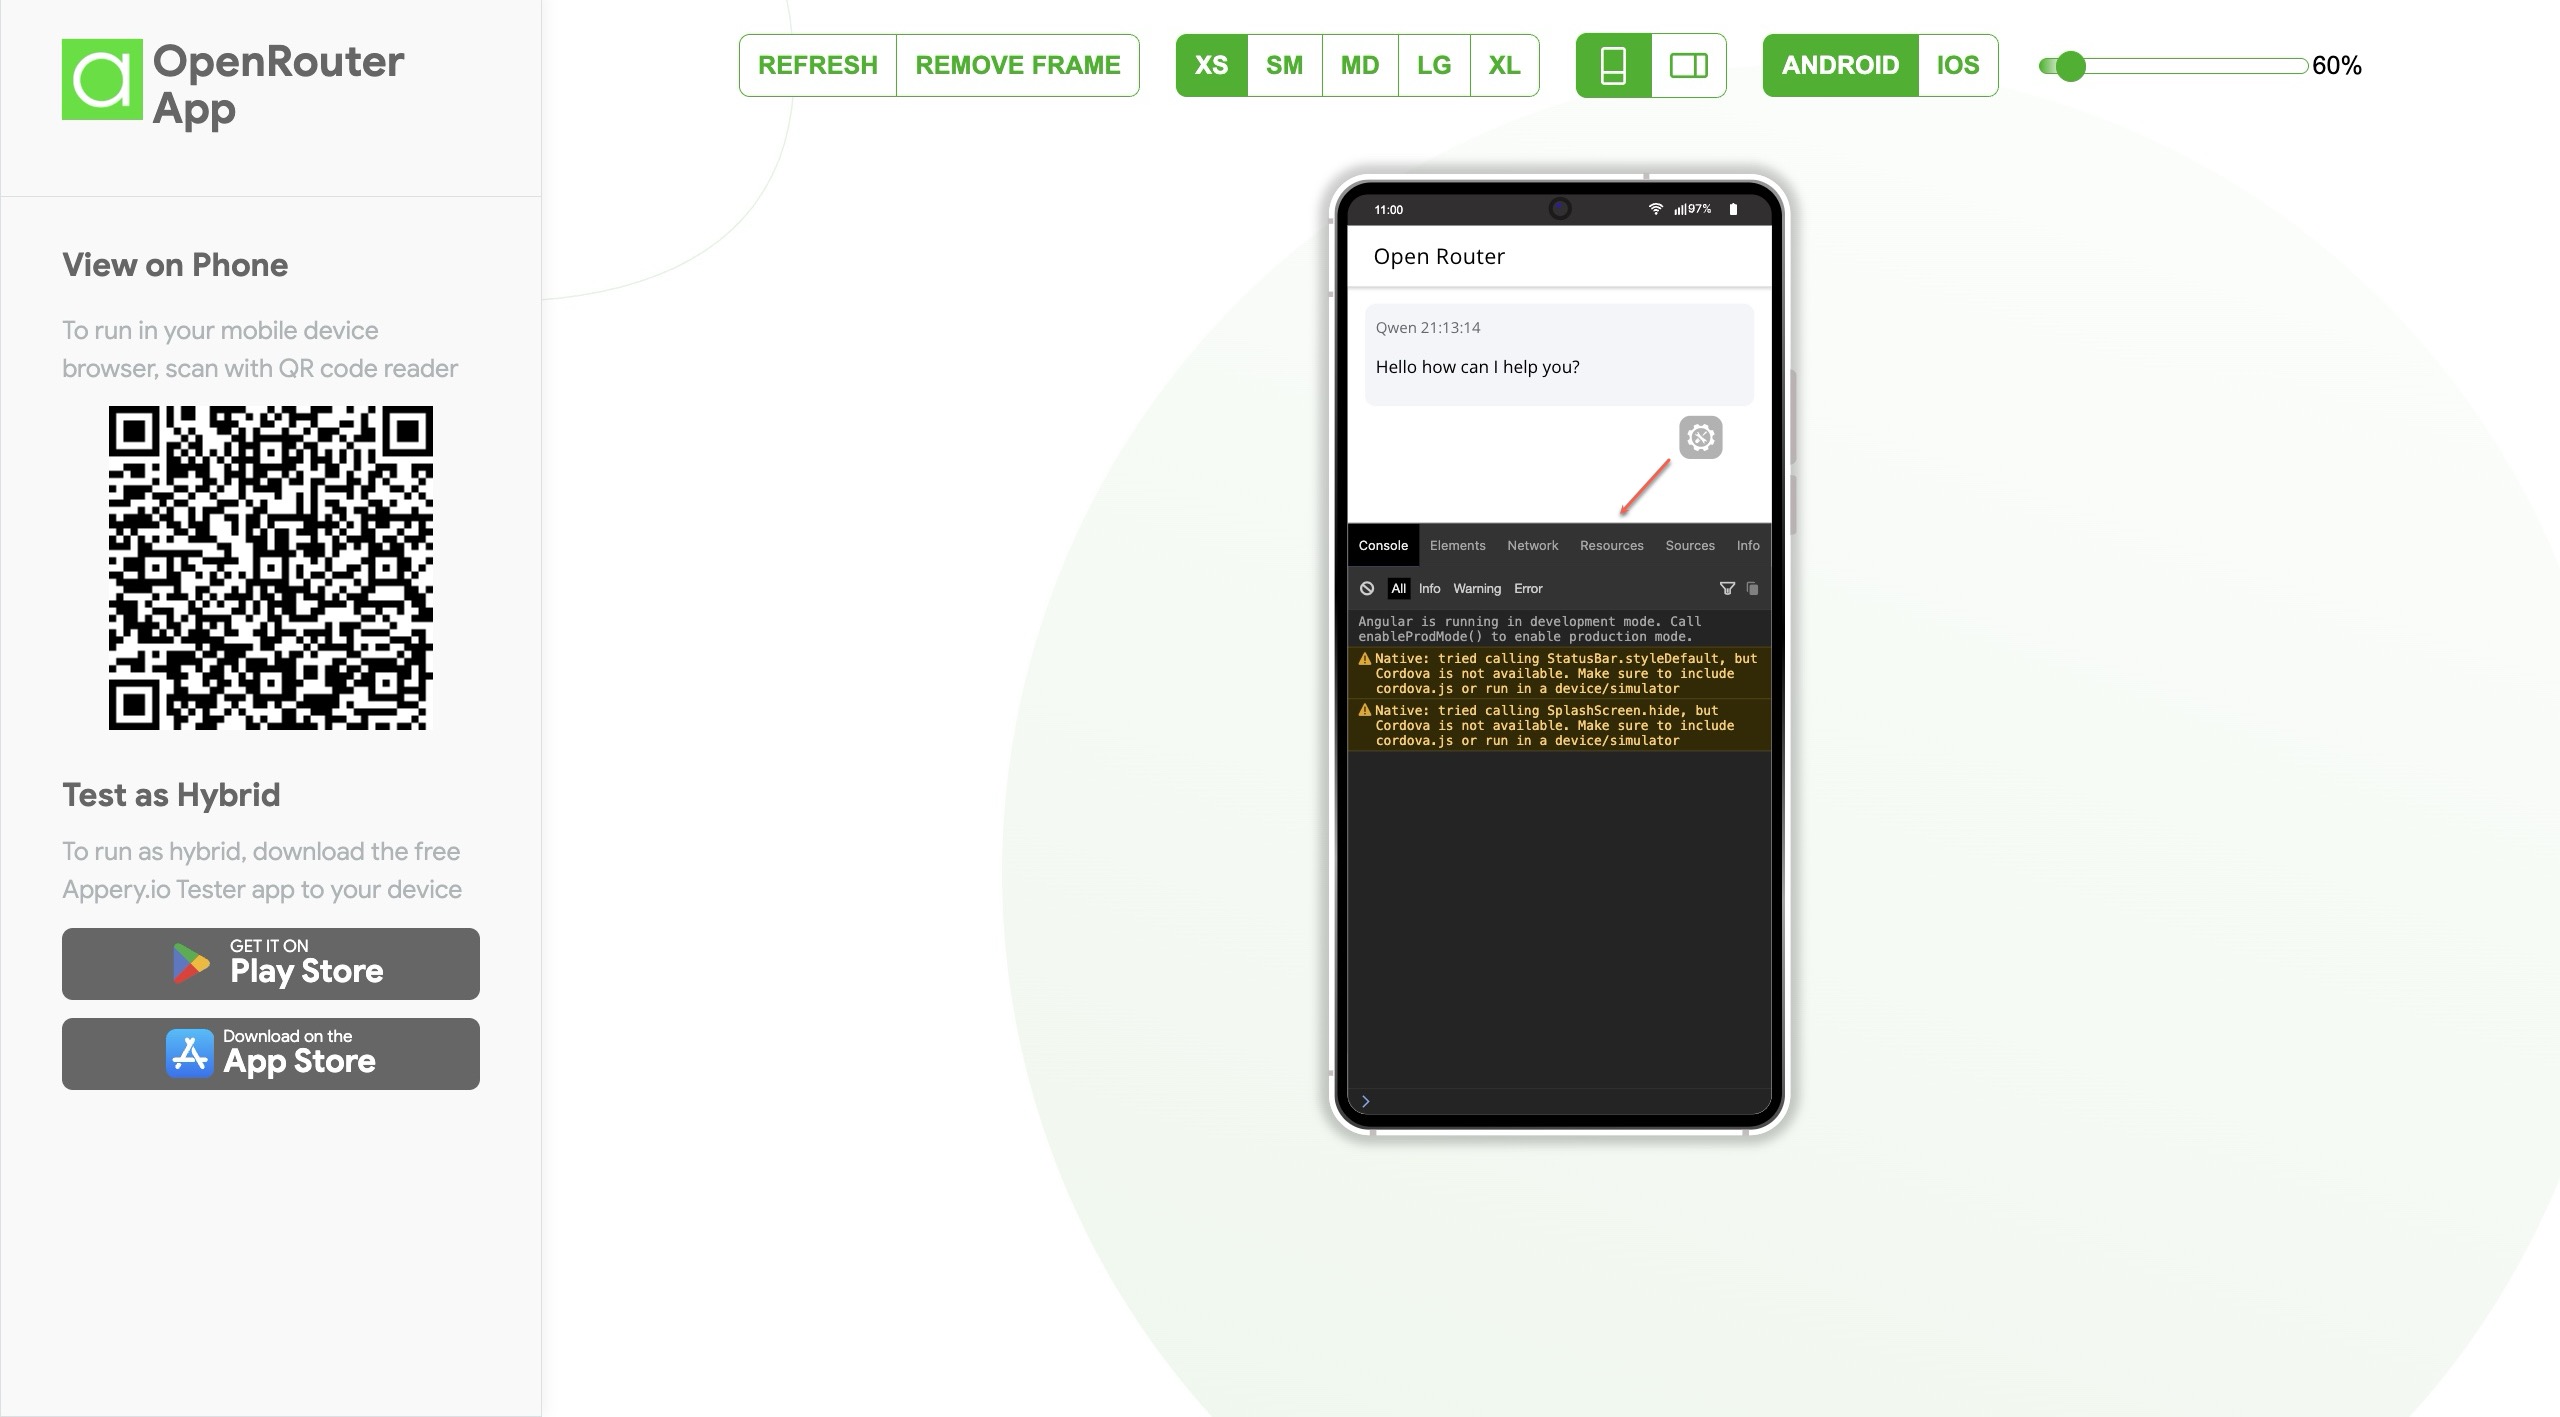
This widget allows access to the built-in developer console for real-time logging and debugging directly on the device (or in preview):
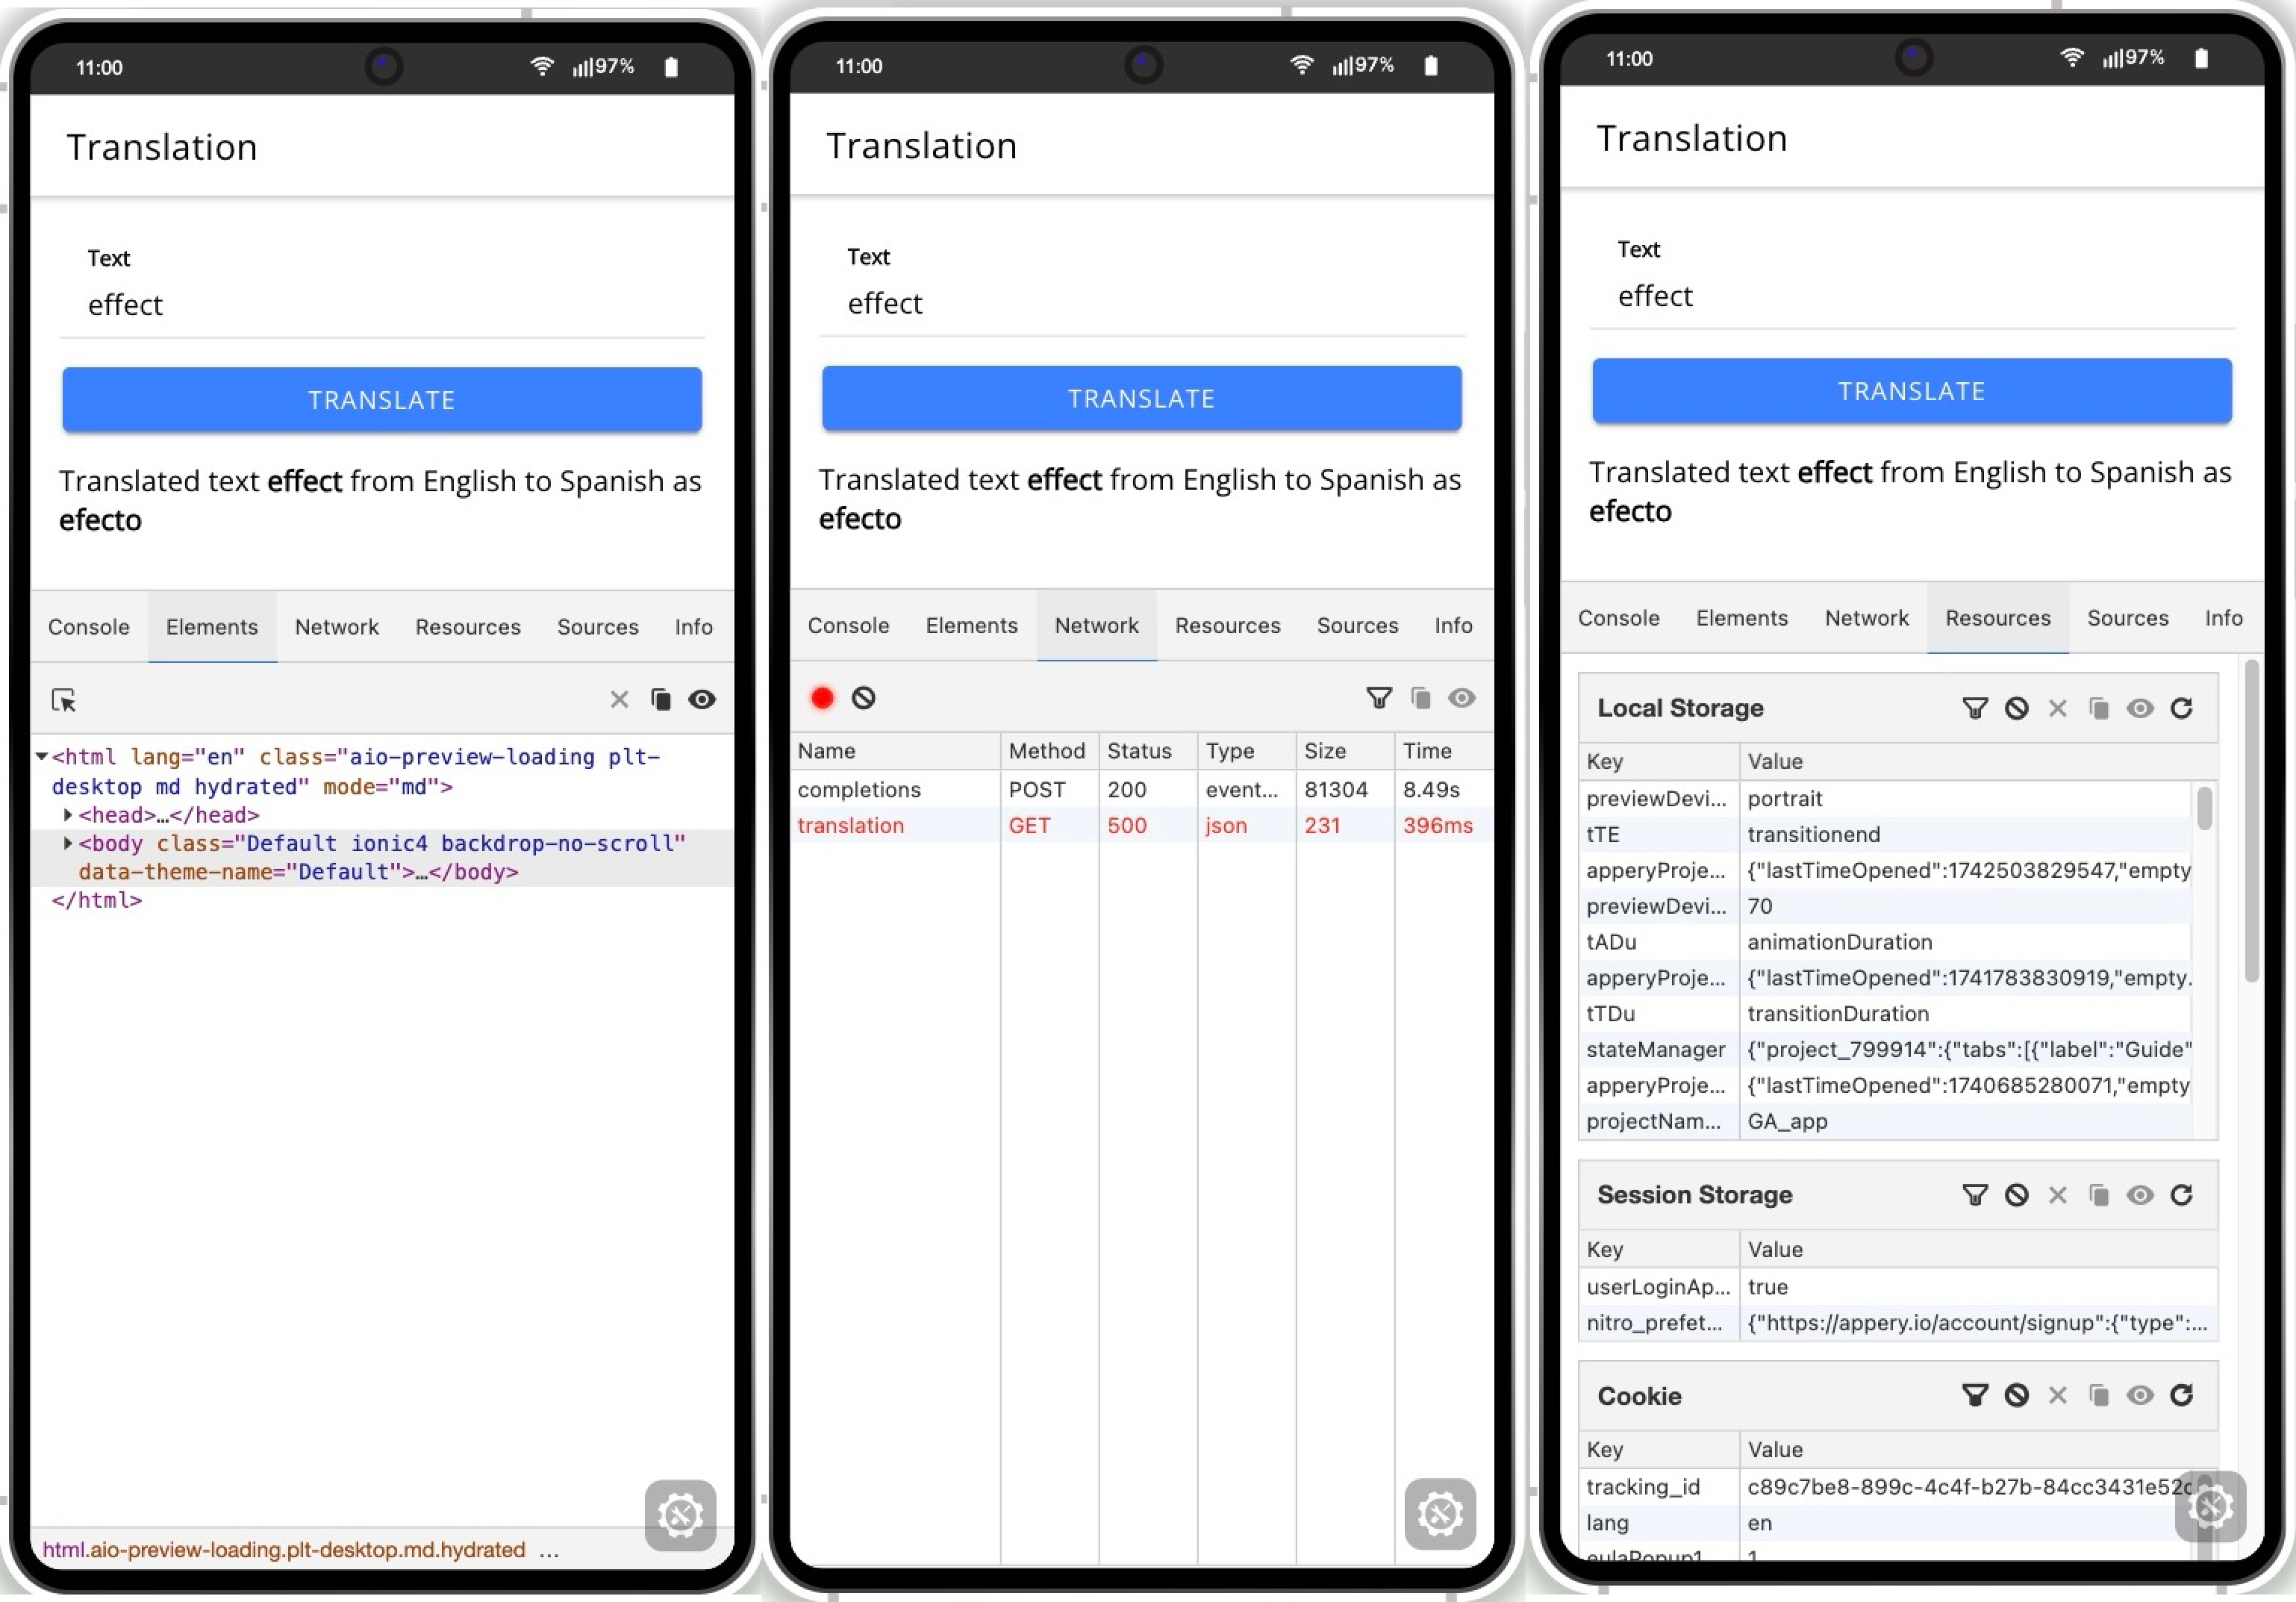
With this option, you can securely debug your project locally by switching between the Console, Elements, Network, Resources, Sources, and Info tabs.
For example, in the Resources view, you can see the local storage and session storage variables:
To exit the Debug console mode, click the widget button again.
Debugging Live Apps
The Debug console feature is invaluable for troubleshooting live apps in production.
It lets you manage and update your app in real time—without disrupting your users.
For this, do the following:
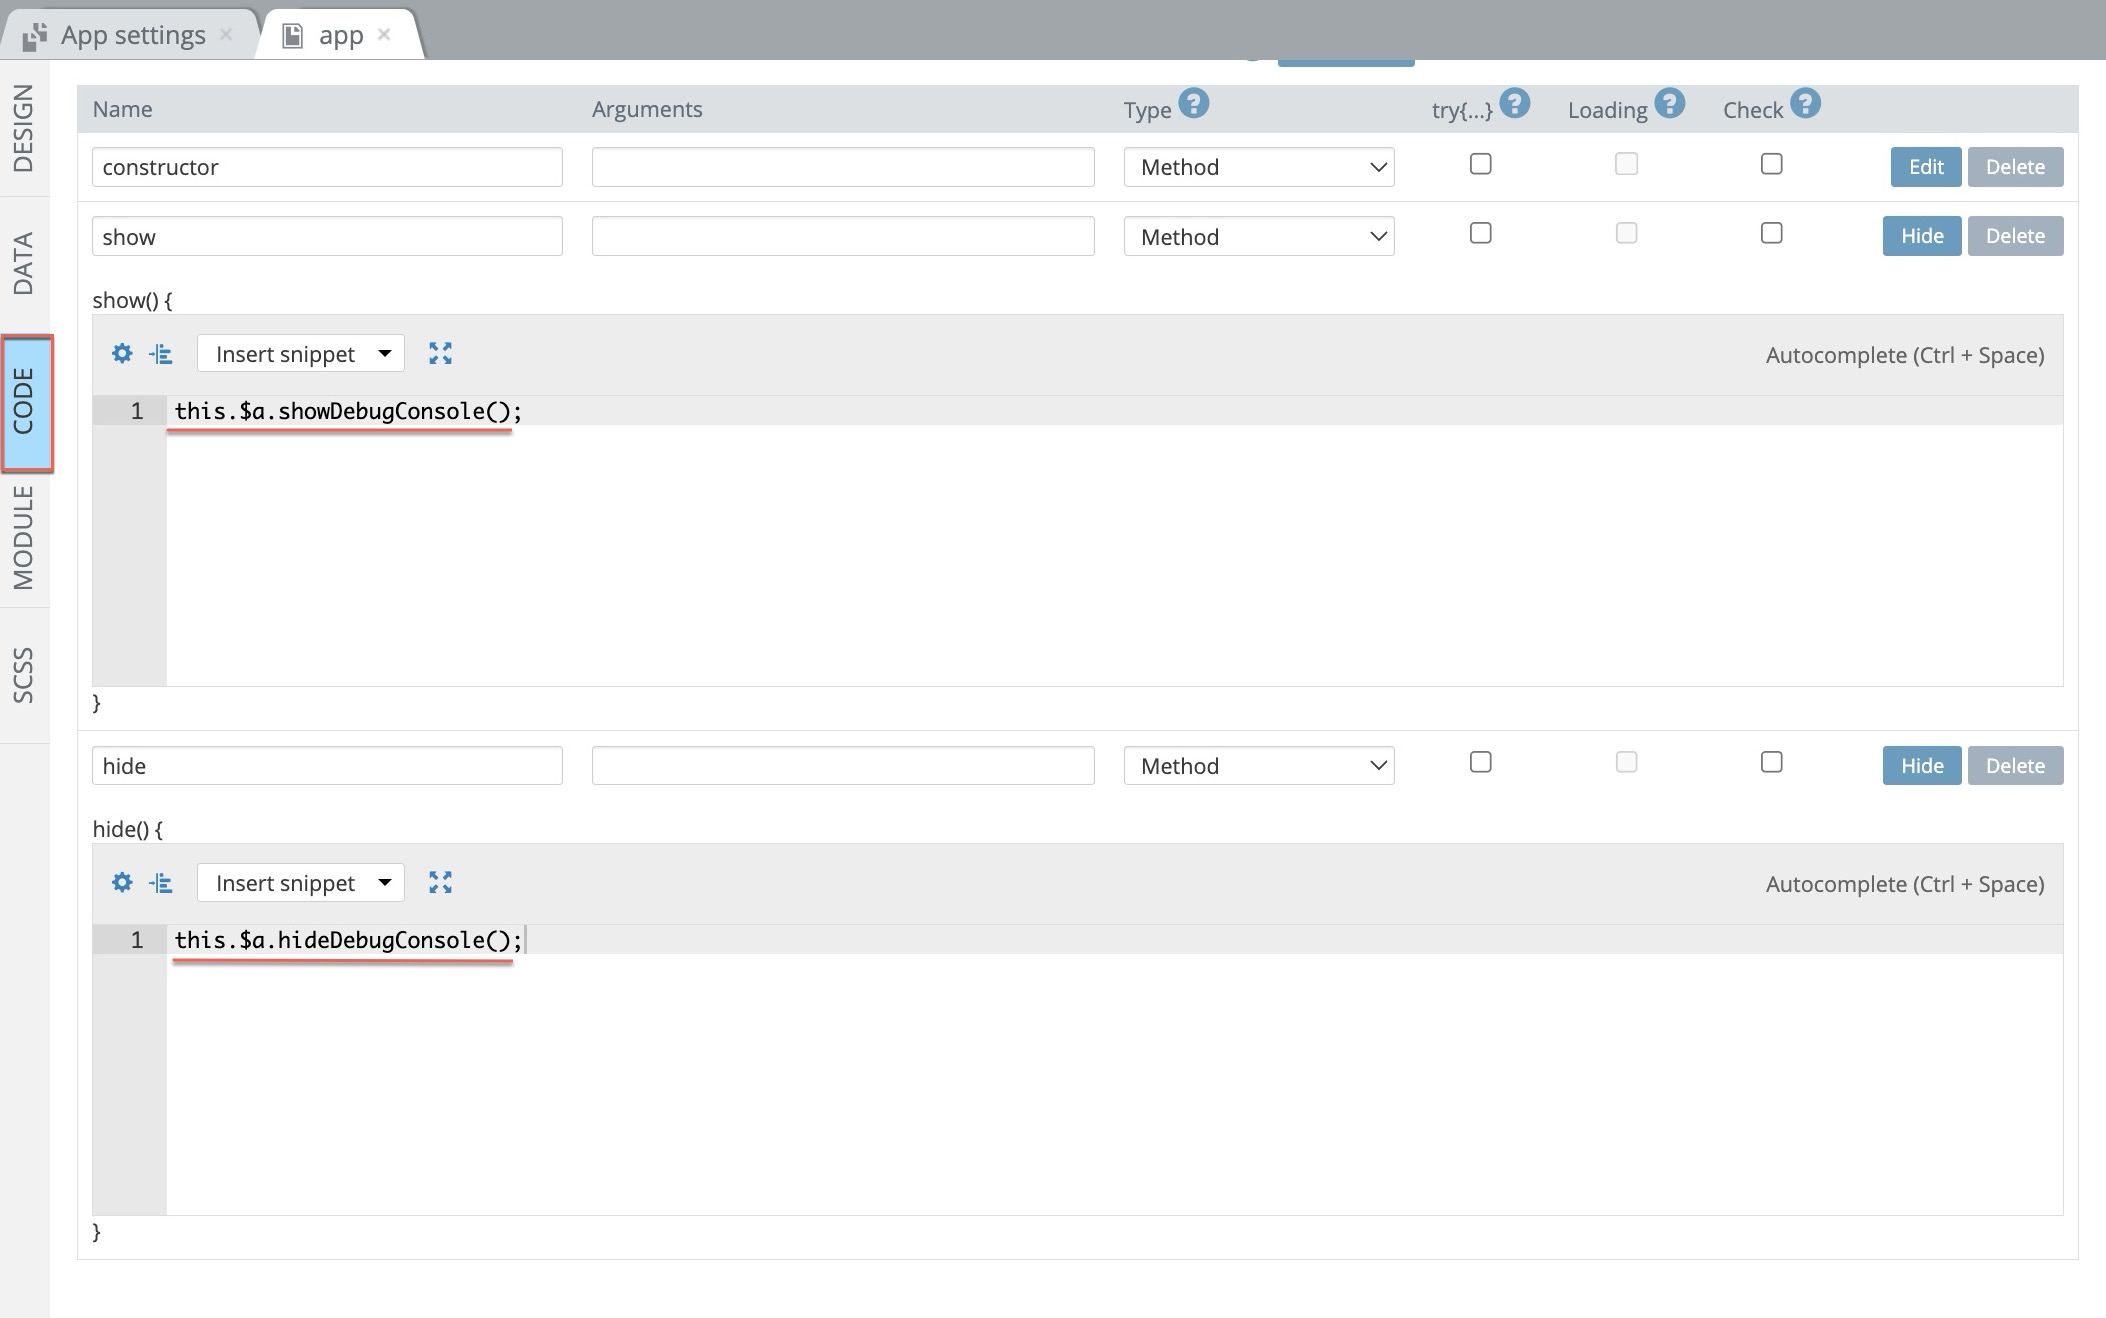
- Add the following methods to the app's page you want to inspect (or to the project app page) :
this.$a.showDebugConsole();this.$a.hideDebugConsole();
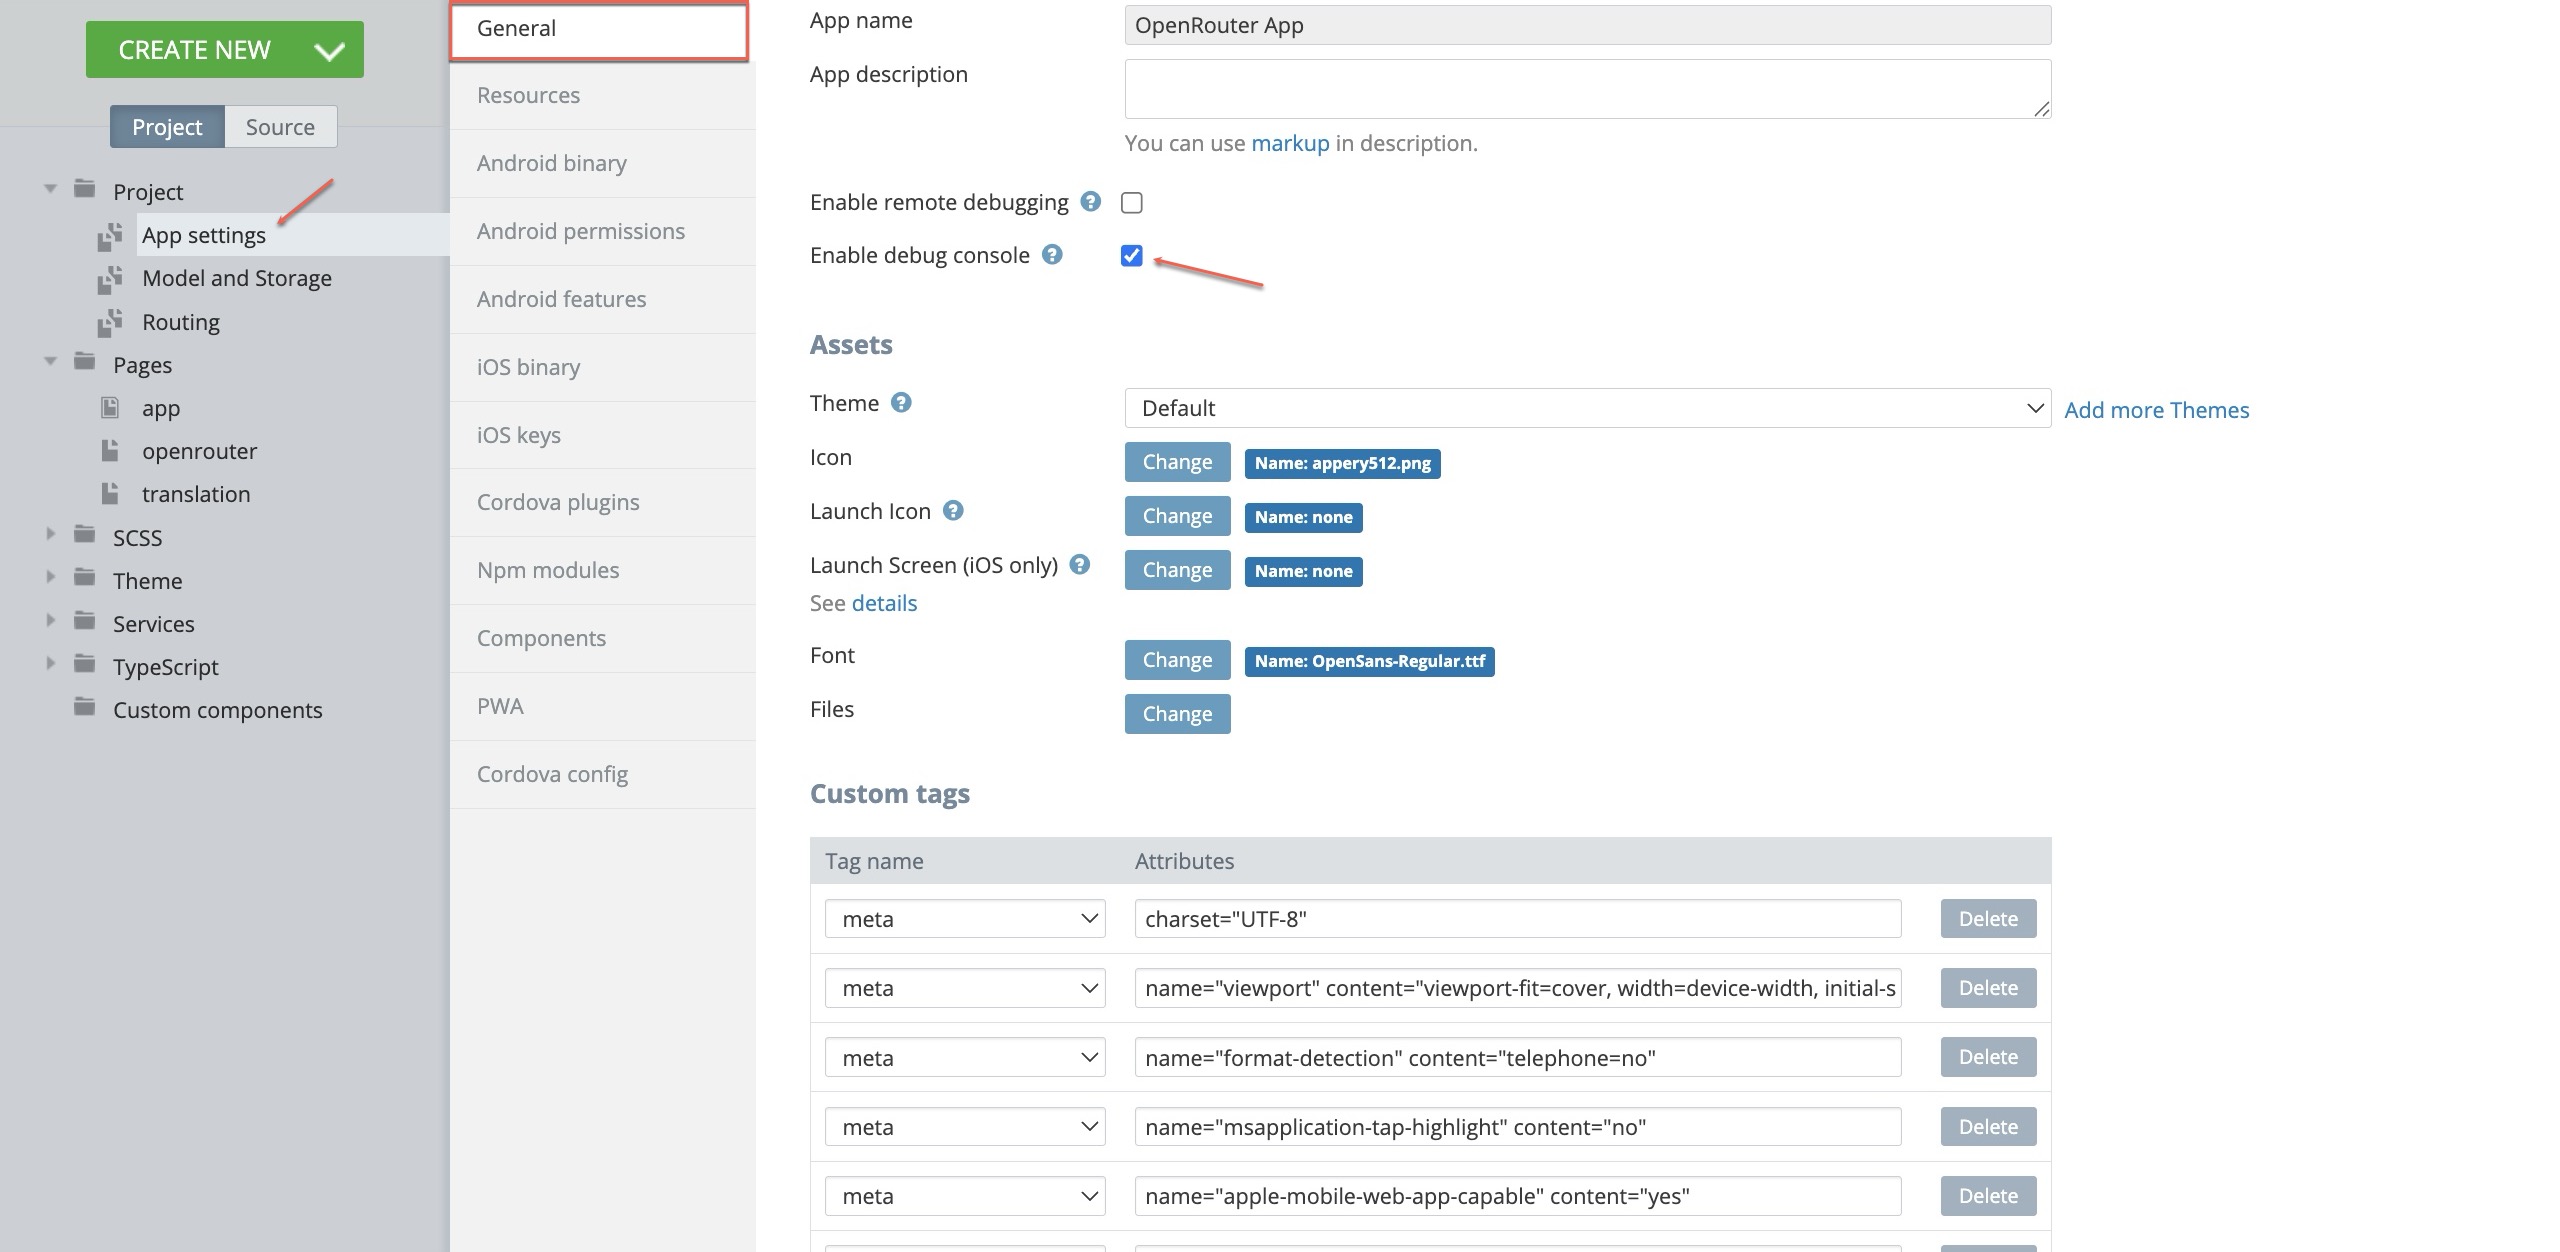
- Go to App Settings > General and enable the Debug console option:
- Save and click to test the app. The draggable debug widget will be shown.
- Click it to run local debugging and switch between the debugging views as needed:
- When finished with debugging, go back to App Settings > General, disable the Debug console option, and save the app.
Updated about 1 year ago