Using Browser Dev. Tools
Using browser debug tools
Your Appery.io app is an HTML5, jQuery Mobile, JavaScript, and CSS app that runs in a browser (or a PhoneGap app). The best way to debug an app is to use the available browser tools: Chrome Developer Tools (Wrench tool > Tools > Developer Tools) or Firefox’s Firebug plug-in. These plugins allow you to inspect:
- DOM elements.
- Request/response information.
- Any JavaScript errors or warnings.
- Browser's local storage.
- And much more.
We use these tools daily and we recommend that you use them as well. Developers building mobile apps via other means use the same debugging tools. Here are a few examples (using Chrome Developer Tools).

Chrome Dev. Tools
Want to Know More?Check our YouTube video tutorial to learn how to fix errors and optimize apps quickly. Learn how to use Appery debugger, inspect variables, and improve JavaScript debugging. We cover mobile app debugging and remote troubleshooting with simple steps. Watch now to get pro tips and make your app run smoothly:
Checking Console for JavaScript Errors
Your app might not work property due to a JavaScript error. Using the Console you can view any errors or warnings produced while loading or running the app:

JavaScript error
Checking Service Invocation
The Network tab will show service invocation information such service headers, response and more. Use this to check that the service is invoked with correct parameters.

Inspecting service invocation
Once a request is selected, you can view its response:

Service response
Viewing Browser Local Storage
Browser local storage plays an important role in many apps. You can quickly view its content as shown below. For example, if your app saves a value into the storage, you can check to make sure that the correct value is saved. Note that local storage shown will be different for each domain. Browser local storage is a standard browser API supported by modern browsers.

Viewing local storage
Visit this page to learn more.
Inspecting Browser DOM
Inspecting the DOM elements to view the app-generated code.

Inspecting generated app code
Use the inspect function to see the exact code which runs in the browser.
Clearing Browser Cache
Browsers love to cache files which sometimes leads to things not working as expected, such as when a new version of a file doesn’t load. It’s always a good idea to clear the browser cache from the browser menu.
If you are using the Chrome browser, here is another (and usually better) way to clear the cache:
- Enter:
chrome://appcache-internals/in the address bar - Find the entry that looks like this:
Manifest: https://appery.io/ - Click Remove
- Reload the app or the app builder
If the project does not load in the Chrome browser try these steps:
- Open browser debugger (F12)
- Go to the Network tab
- Click the Disable cache check box:
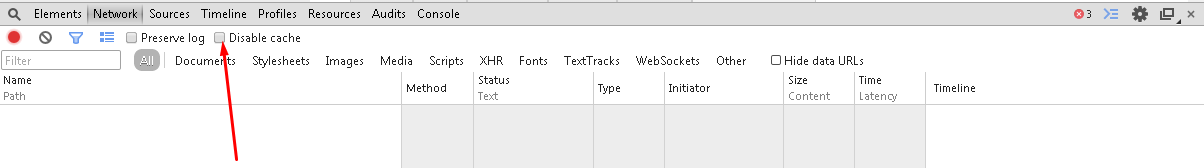
- Clear the cache.
- Reload the App Builder.
- If project loads correctly then you can uncheck this option.
TipPlease note that disabling cache makes things run a little bit slower.
Checking JSON/XML response
http://jsonlint.com (or http://www.xmlvalidation.com/) – to check if your JSON response has a valid format.
Browser Support for Specific Features
http://caniuse.com/ – compatibility tables for HTML5, CSS3, SVG, etc., support in desktop and mobile browsers.
JavaScript and CSS Debugging Tips and Tricks
Read more here: https://css-tricks.com/debugging-tips-tricks/
Updated about 1 year ago