Weinre Debugger
Using Weinre Remote Debugger
The Weinre debugging feature allows you to debug your app while testing it in the browser or on a device. To enable the Weinre debugging, open the App settings and check the Enable Weinre debugging box.
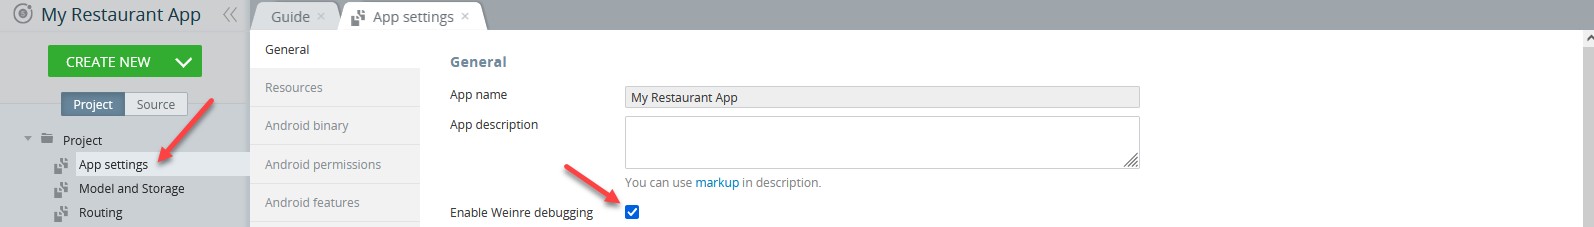
A debugging URL will appear. When testing the app you can open the link or click Launch in debugger.
Important!Before debugging, open the app Preview in the browser or click Test on the device and scan the QR code, otherwise, you can install the app binary file on a device.
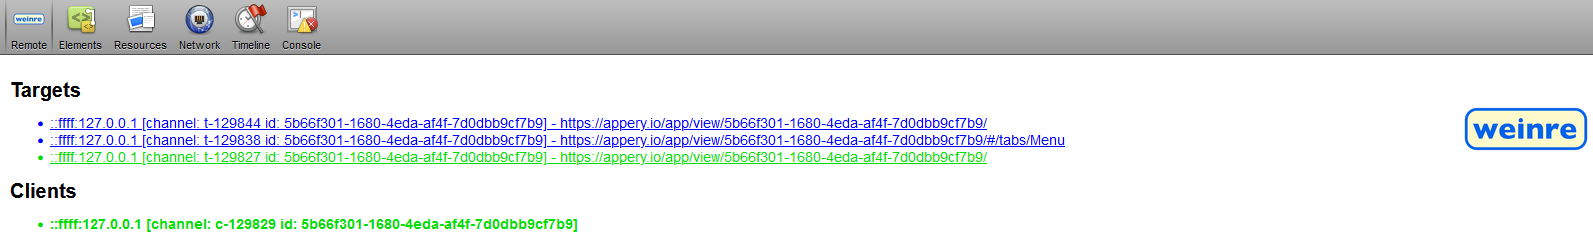
You’ll see all of the target devices and client browsers connected to the debugger. If you are running multiple application instances, multiple targets are shown (the active target is highlighted with green). Select the device that you are going to debug:
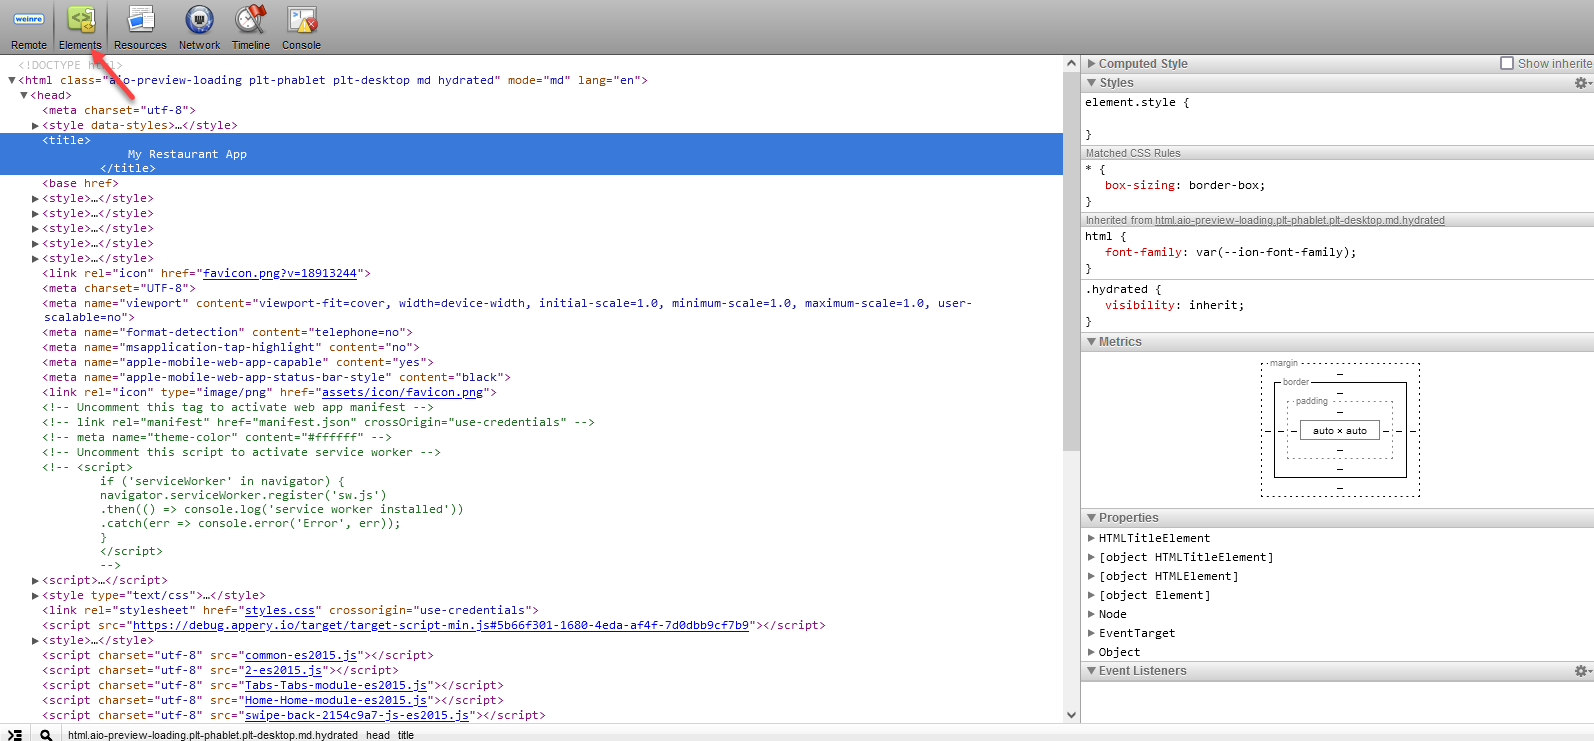
Open the Elements view to inspect the DOM elements, (you can edit attributes, styles and properties). The actual component layout is instantly highlighted in the running app:
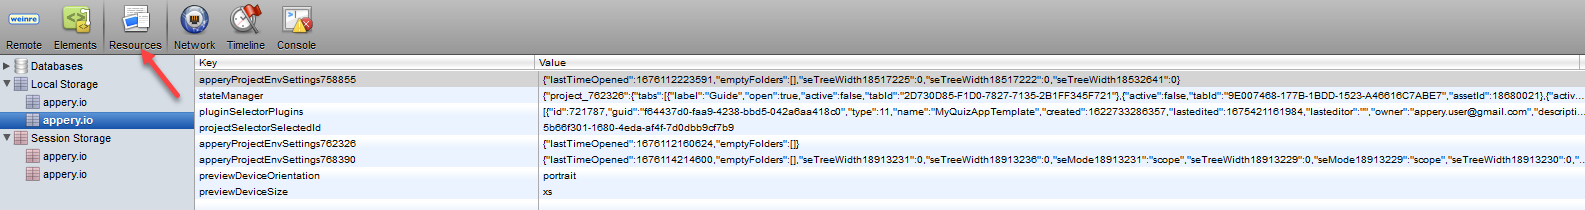
In the Resources view, you can see the local storage and session storage variables. The Network inspector allows you to see all of the network requests (except JSONP requests):
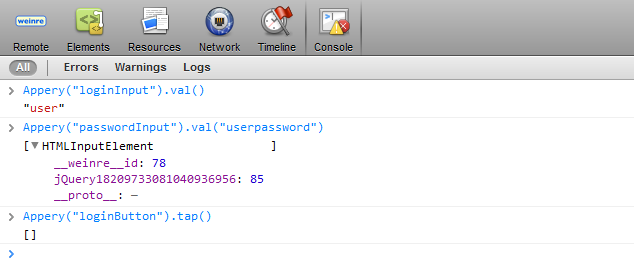
In the Console view, you can run JavaScript that will execute in your app:
Updated about 1 year ago